

I keep an Apple Note of amazing charts and ideas I find online. A few months ago I published the most important charts of 2026 so far (which you can read here). Here are the most important charts from the second half of 2026. Enjoy!
LABOR MARKET
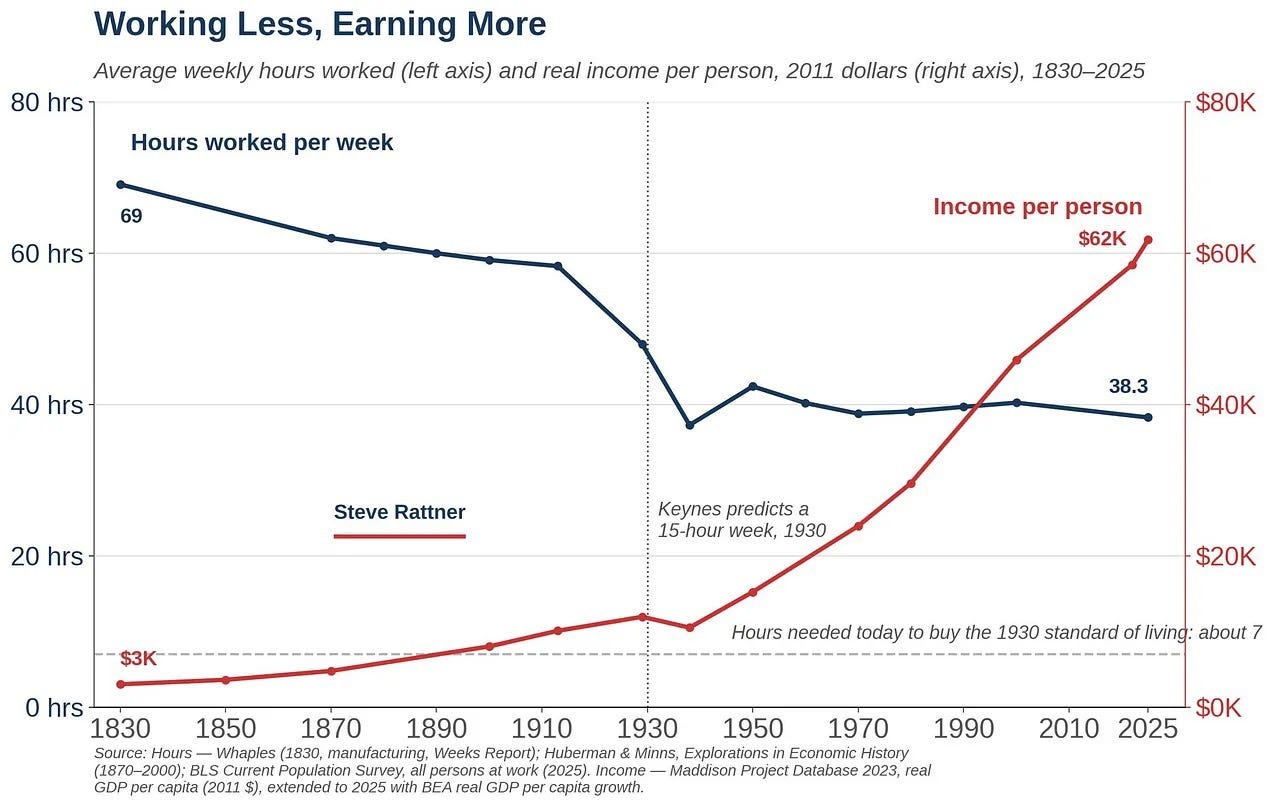
1. The typical person today works less and makes more than the typical person in 1800.
In 1930 Keynes predicted we’d have 15-hour work weeks.
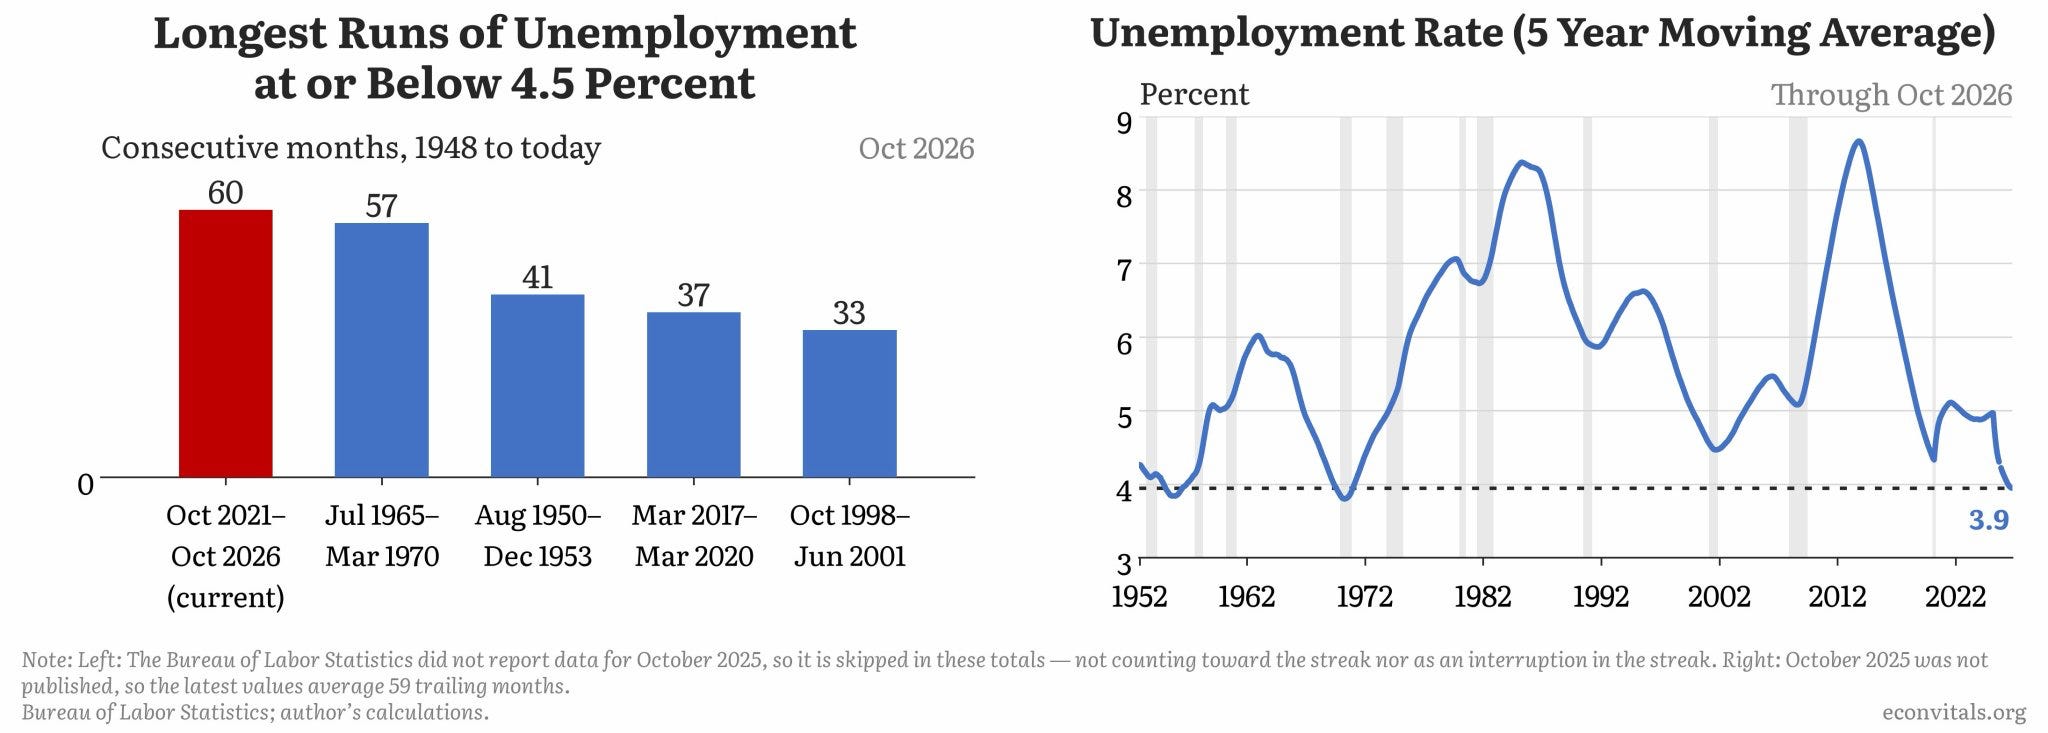
2. We’re in our longest run of unemployment being at or below 4.5% since 1948.
But compared with the last half-century, the economy hasn’t been as strong.
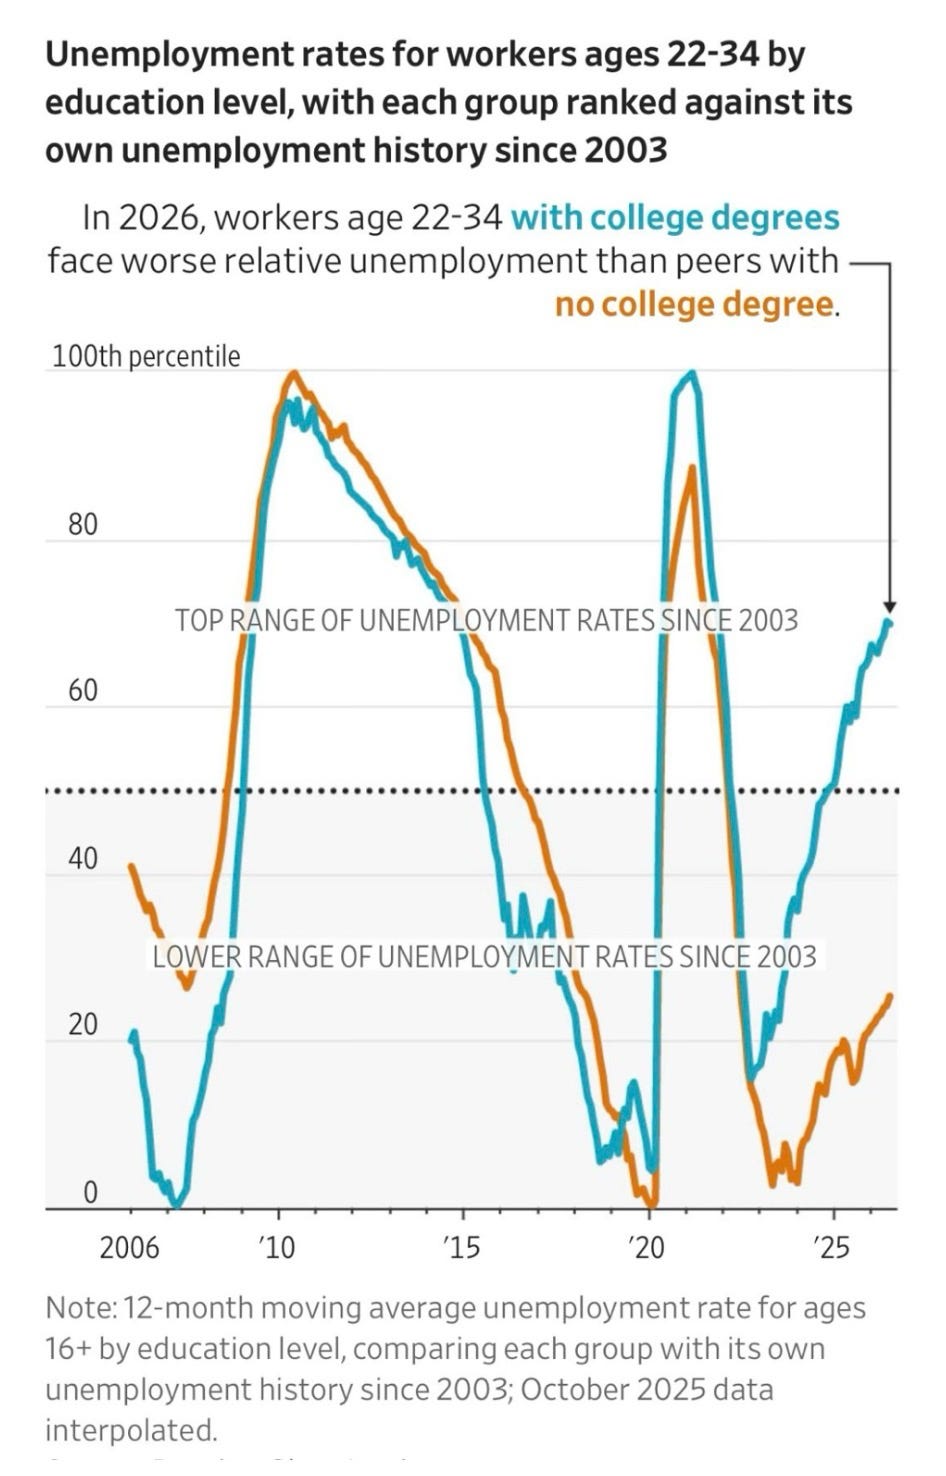
3. In 2026, workers age 22-34 with college degrees face worse relative unemployment than peers with no college degrees.
A big part of why the economy sucks is that young people are struggling with employment — even if they have a college degree.
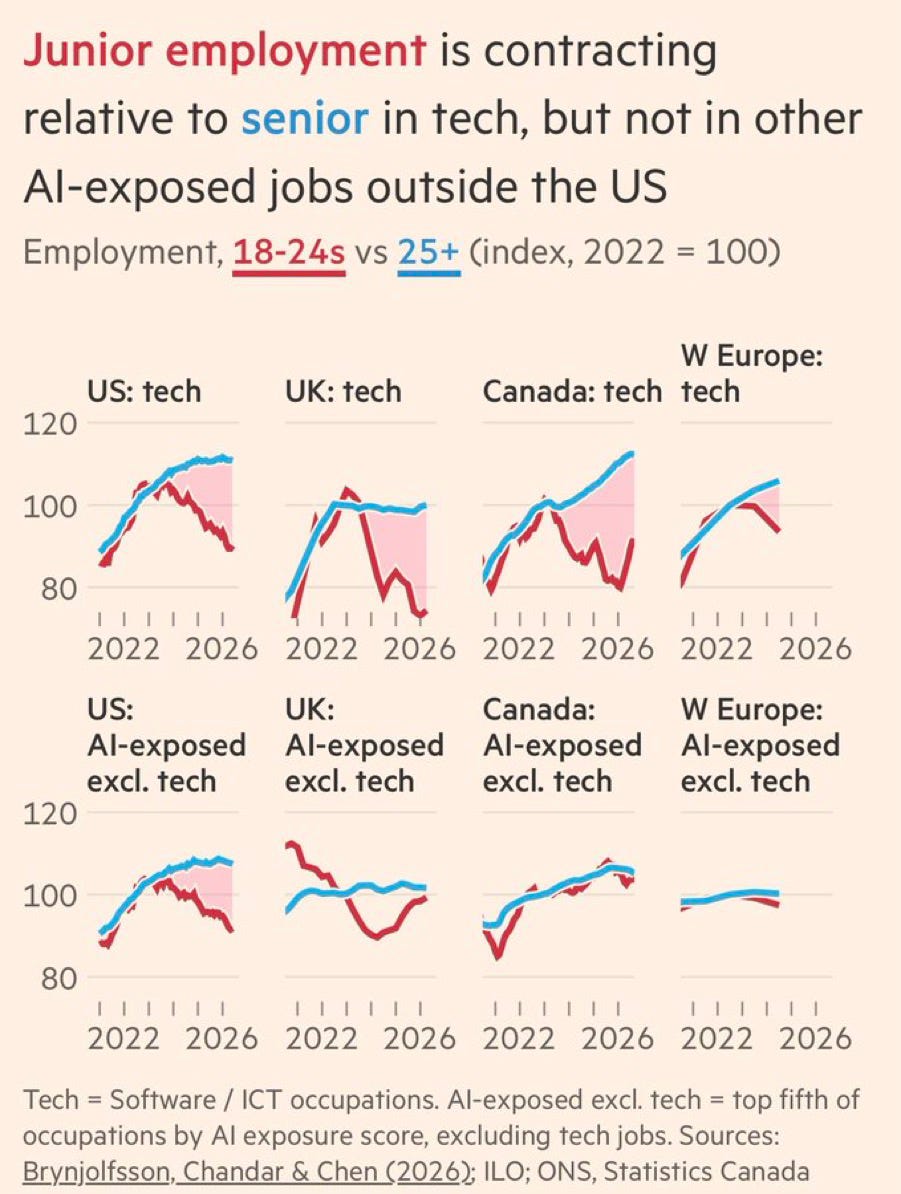
4. Junior employment is contracting — but not in other AI-exposed jobs outside the U.S.
Perhaps not hiring young people is part of a marketing stunt to make it seem like we’ve already reached AGI?
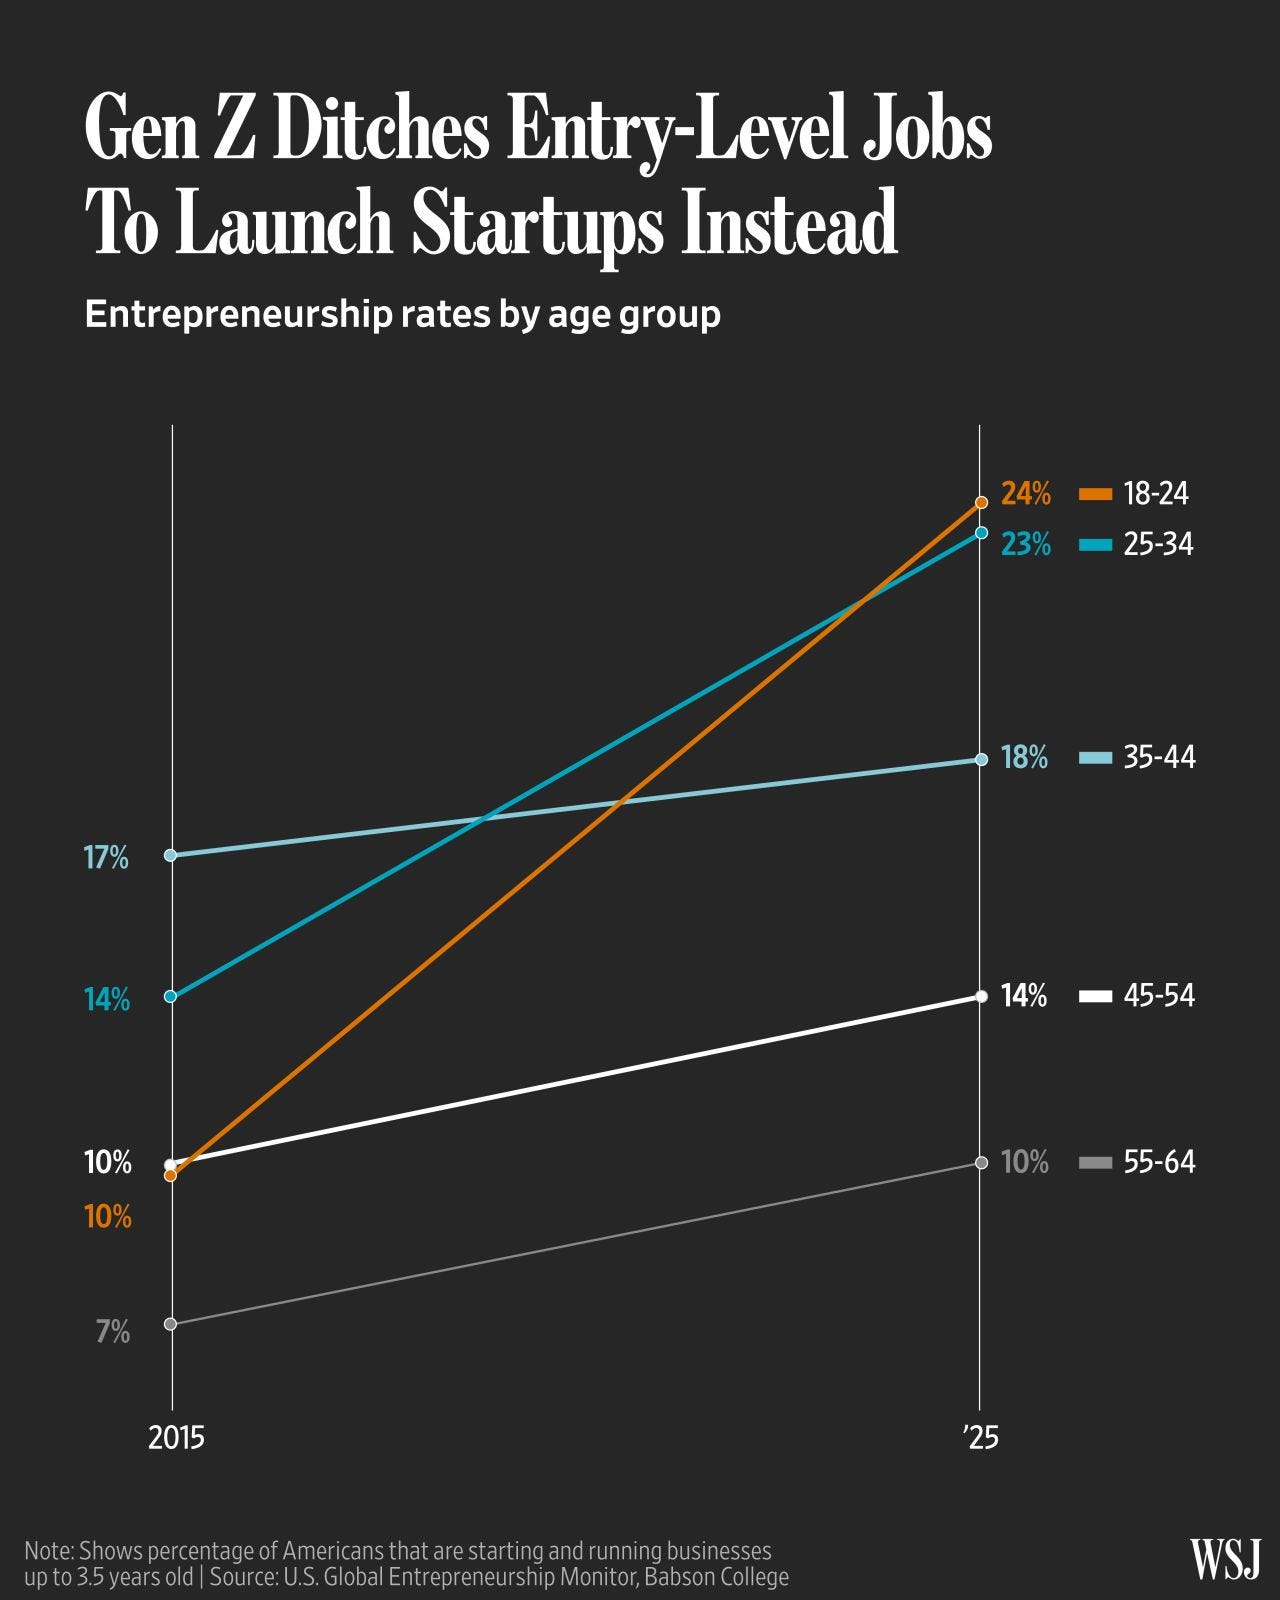
5. Entrepreneurship rates among Gen Z are rising.
As a result, it appears that Gen Z and some Millennials are going into entrepreneurship, even though entrepreneurial success is higher among older people.1
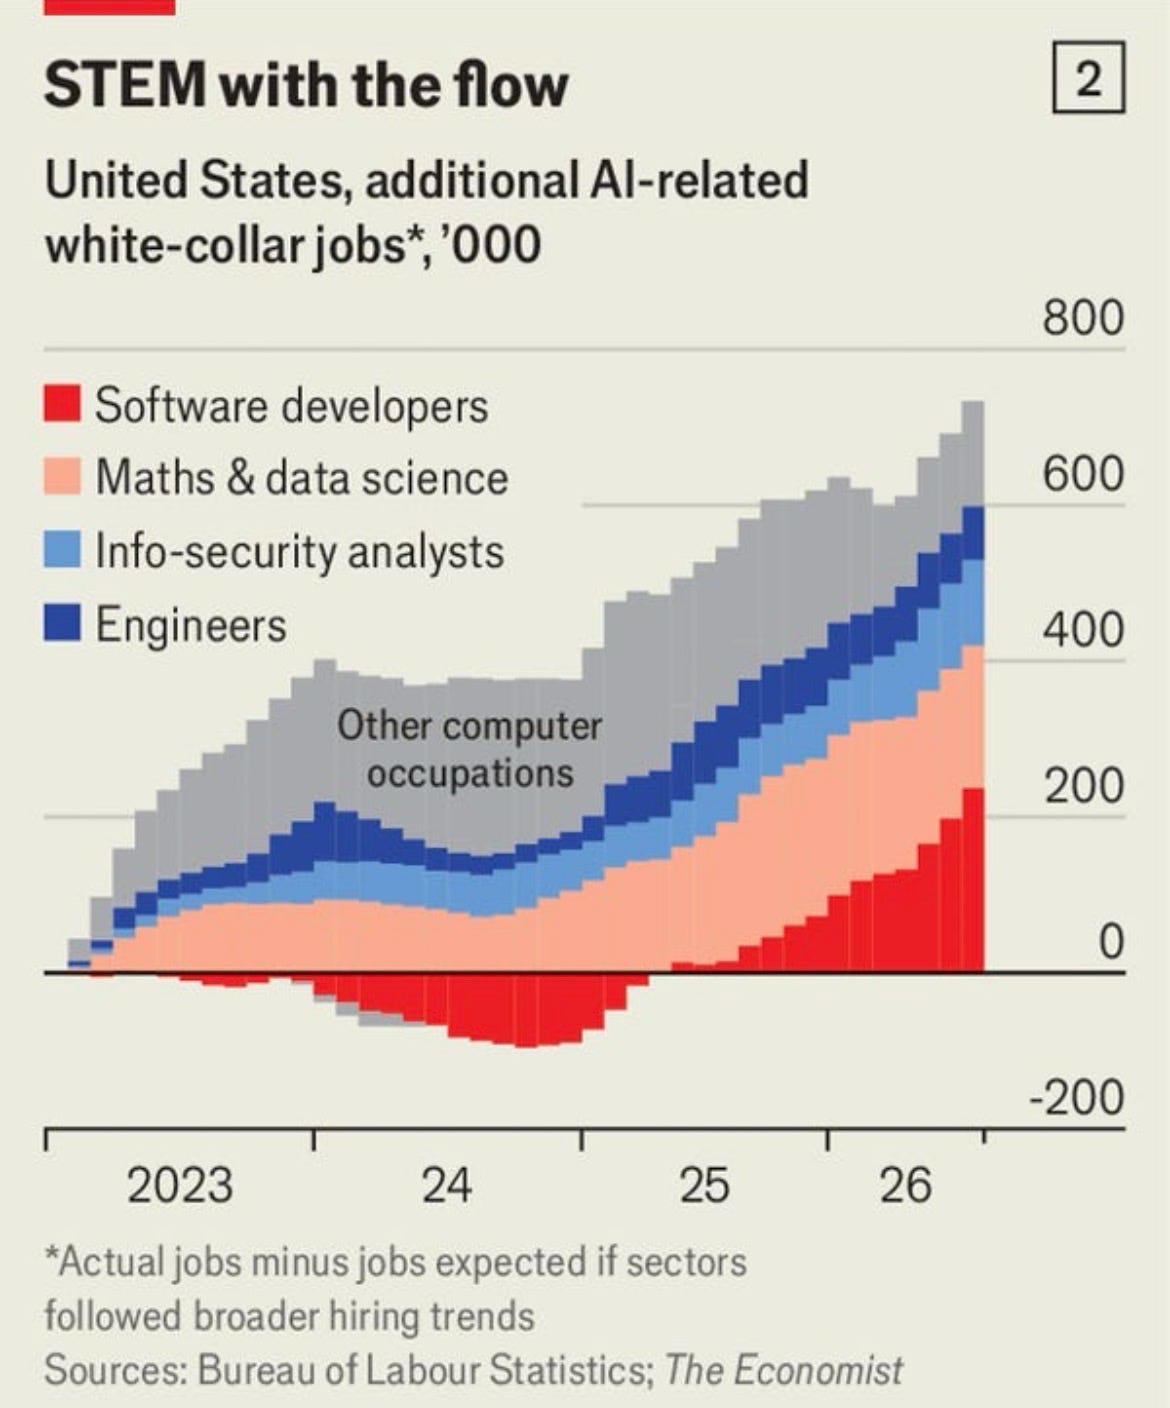
6. And yet overall, STEM job hiring is robust.
ECONOMY
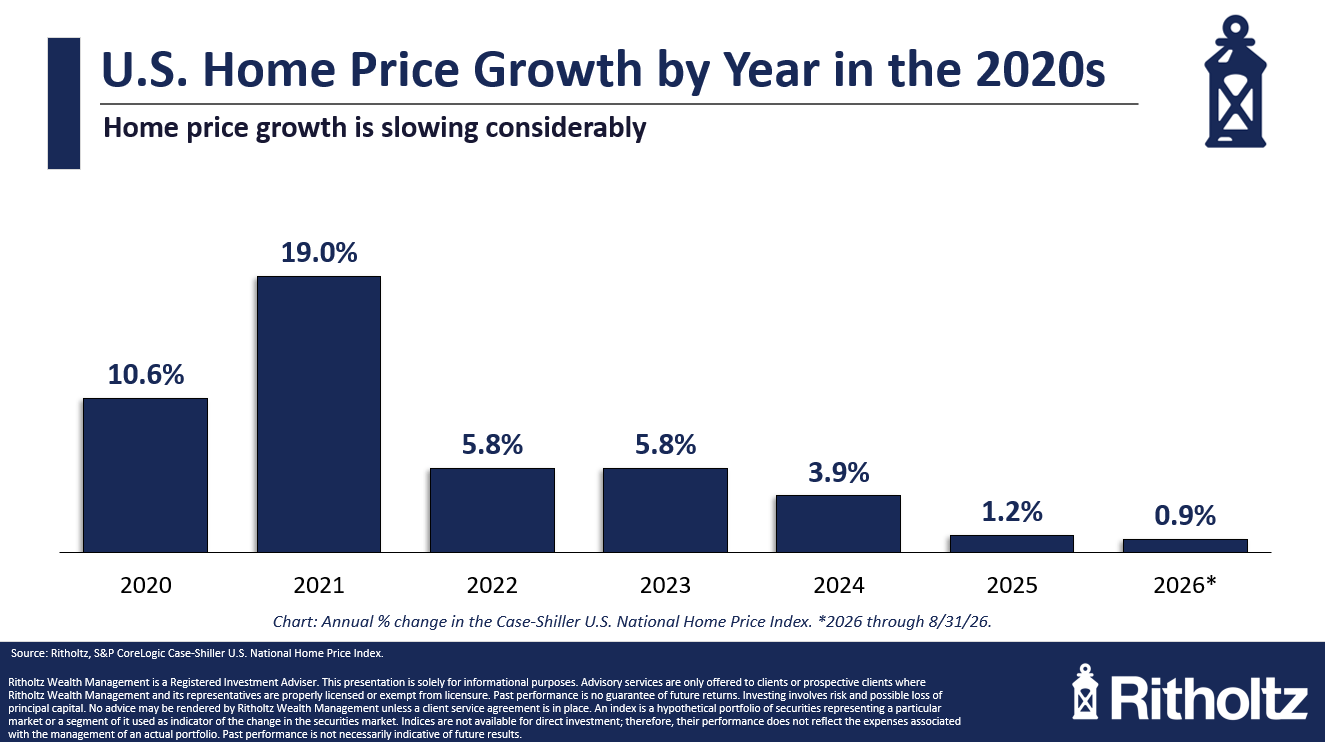
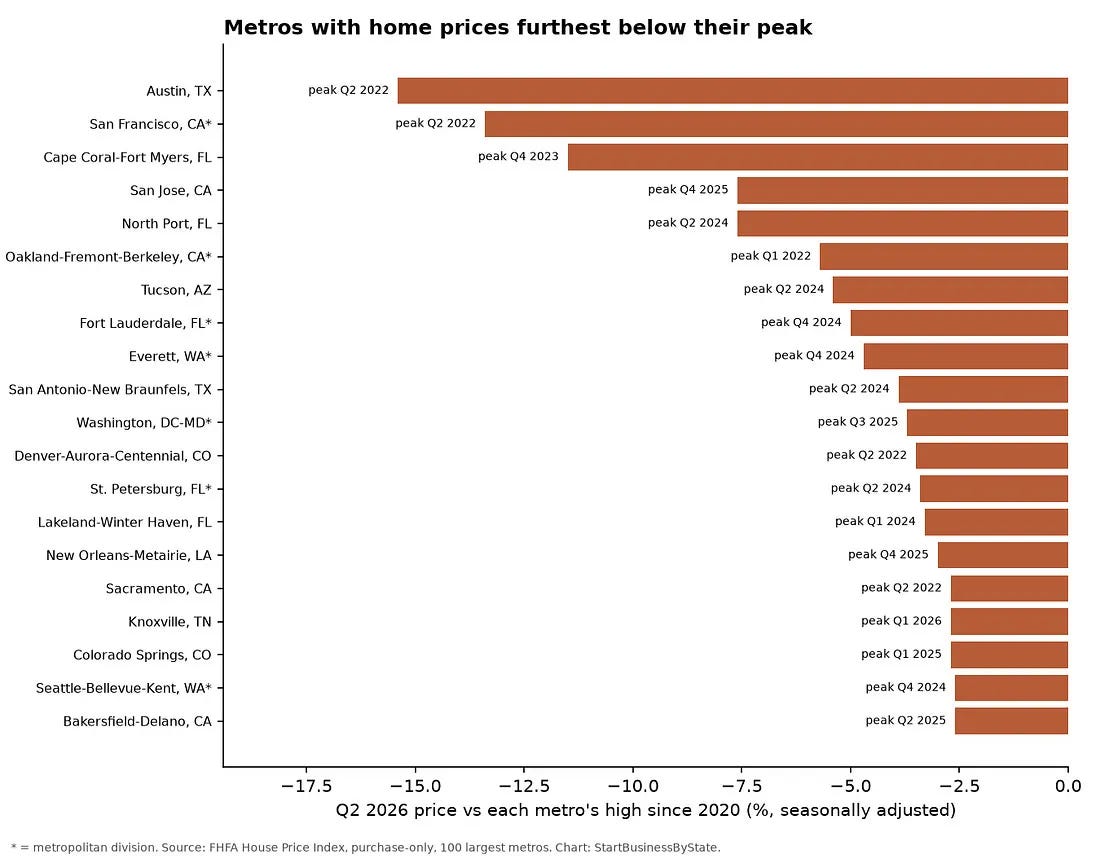
7. U.S. home price growth is finally slowing down.2
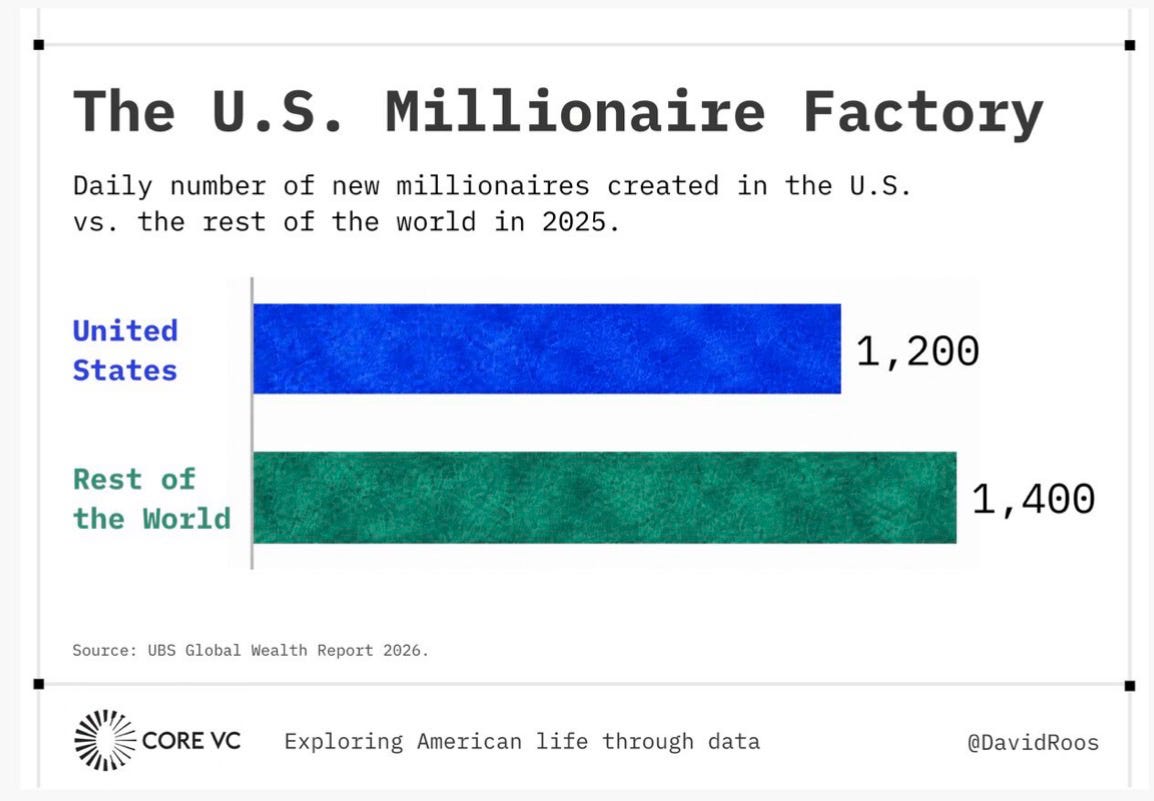
8. The U.S. created almost as many new millionaires per day as the rest of the world combined in 2025.
Warren Buffett called this one “the ovarian lottery”. Or the idea that being born in the United States is the equivalent of a lottery ticket. I agree!
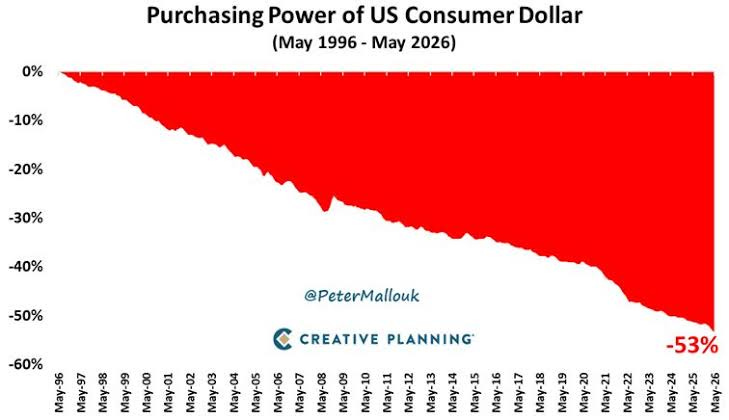
9. Purchasing power of the U.S. down 53% since 1996.
Is the U.S. dollar no longer a store of value? Seems like it’s just a medium of exchange now. How does that impact how we consider currencies globally?
CAREER
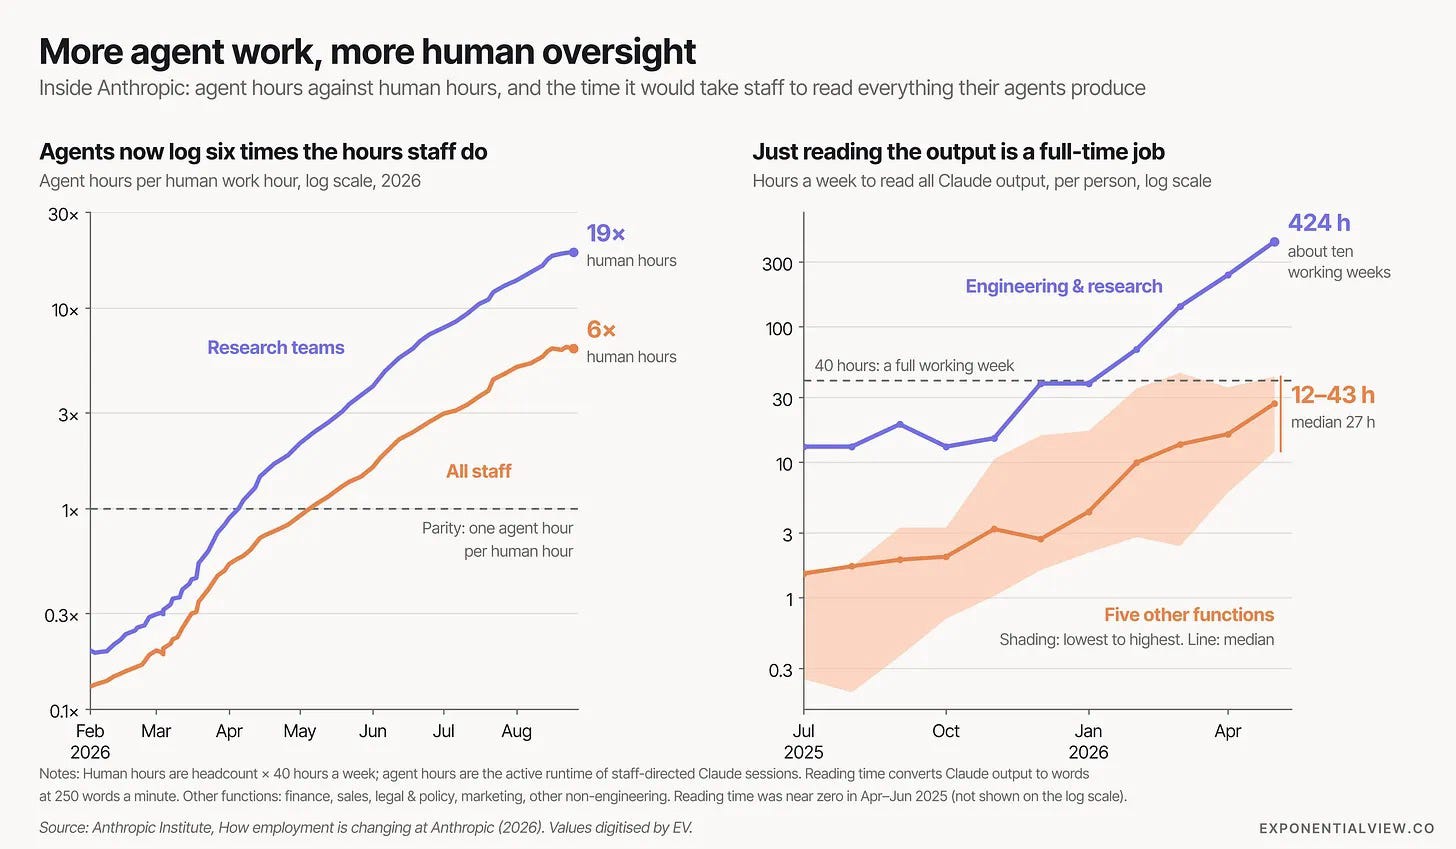
10. More agentic work = more human oversight.
It’s a cliche that the future of work will entail managing AI agents’ output. But it appears that we’re already here. Engineering and research teams at Anthropic spend the equivalent of a full-time job managing AI agent output.
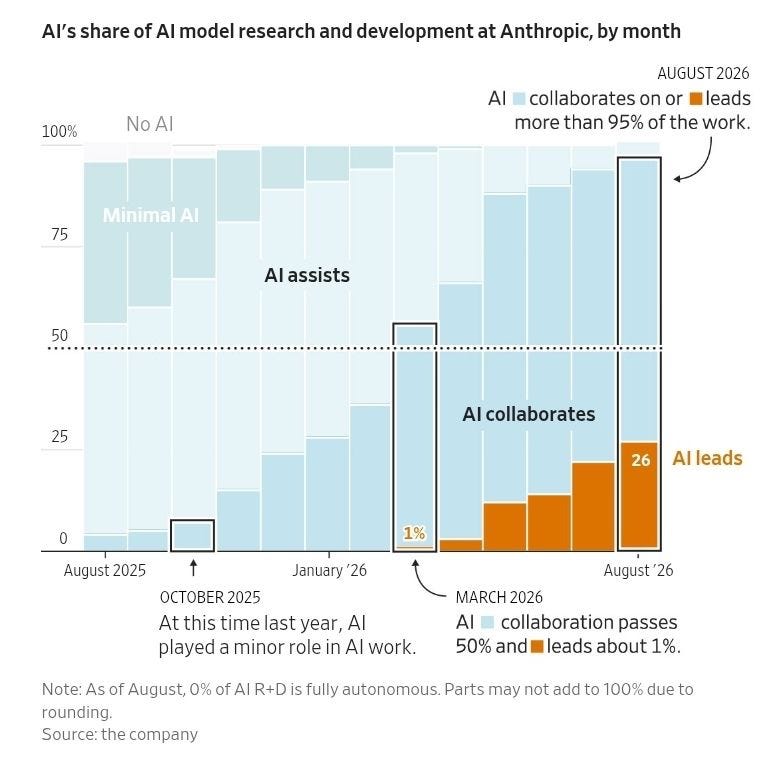
11. AI’s share of AI model research at Anthropic, by month.
Recursive self-improvement (RSI) is every AI researcher’s wet dream. Is it already here?
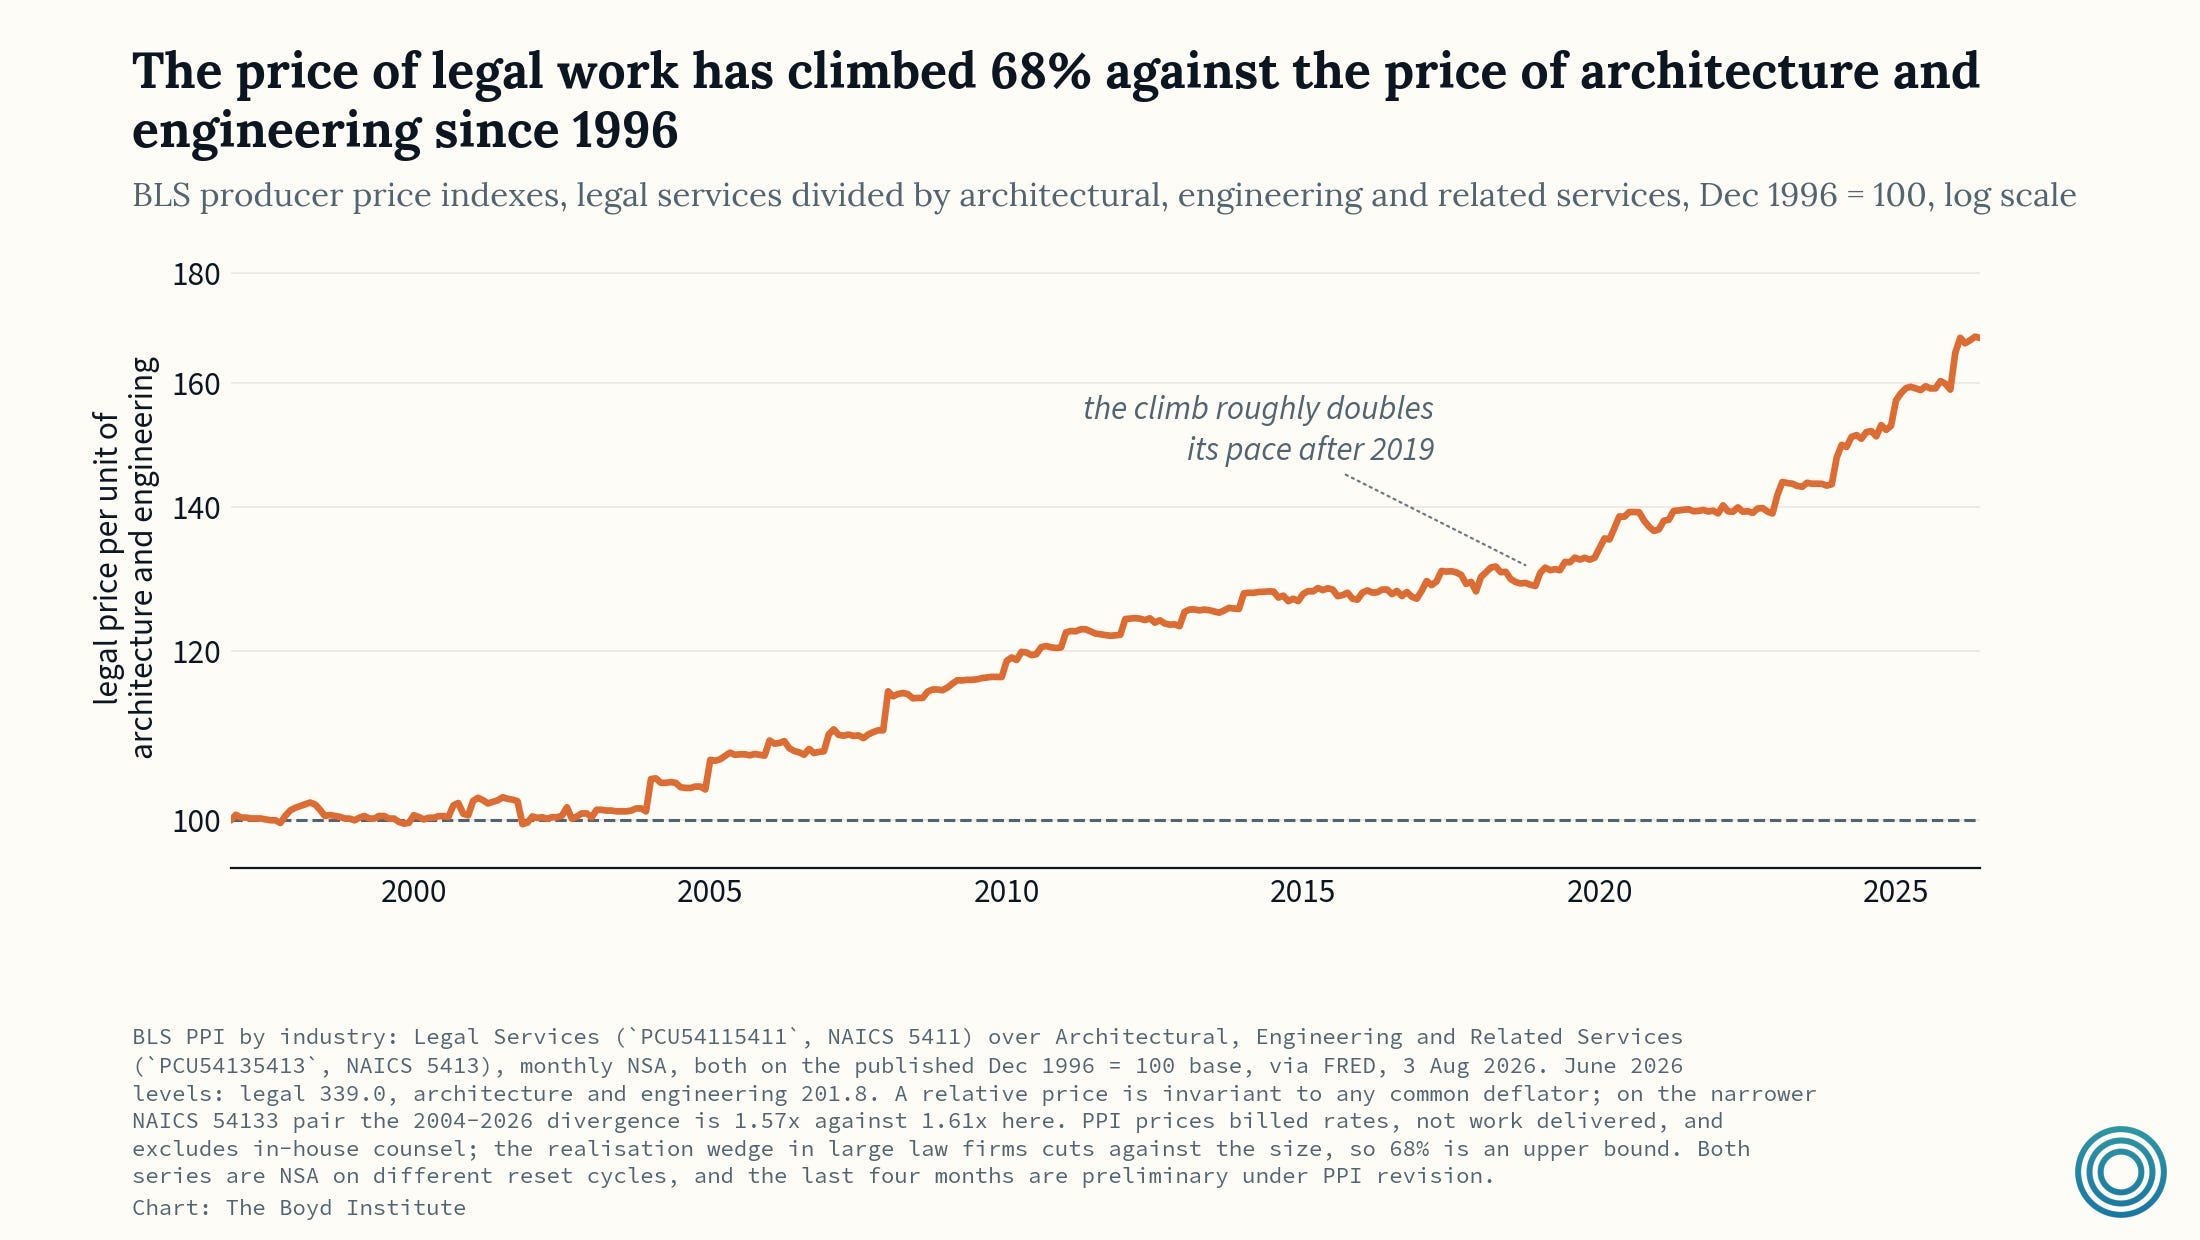
12. The price of legal services has climbed relative to architecture and engineering services since 1996.
America has become a bureaucratic nightmare… and a lawyer’s wet dream. Thank God we have AI to help us navigate the increasingly complex U.S. tax code.
Even in the midst of law firm job replacement, maybe now’s the best time to become a lawyer enabled by AI?
TECHNOLOGY
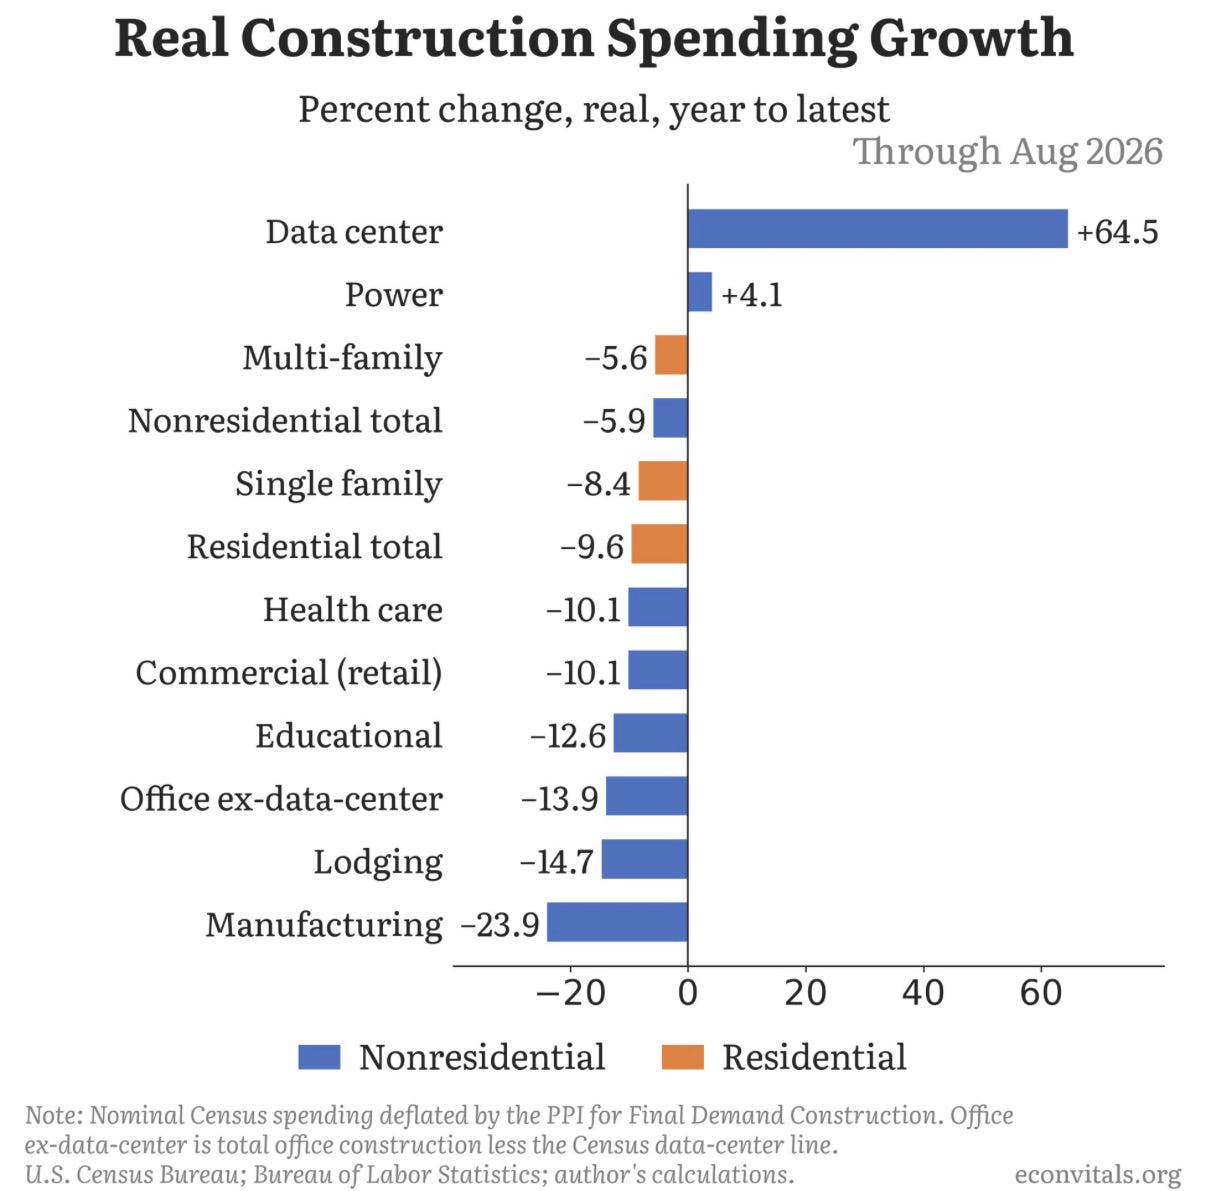
13. Construction spending growth going almost entirely to data centers.
Whether it’s because of Richard Sutton’s The Bitter Lesson or Dario’s Big Blob of Compute, everyone’s betting the farm on building more data centers to support more compute.
This is one of many reasons why I don’t think the housing shortage is going to be over anytime soon.
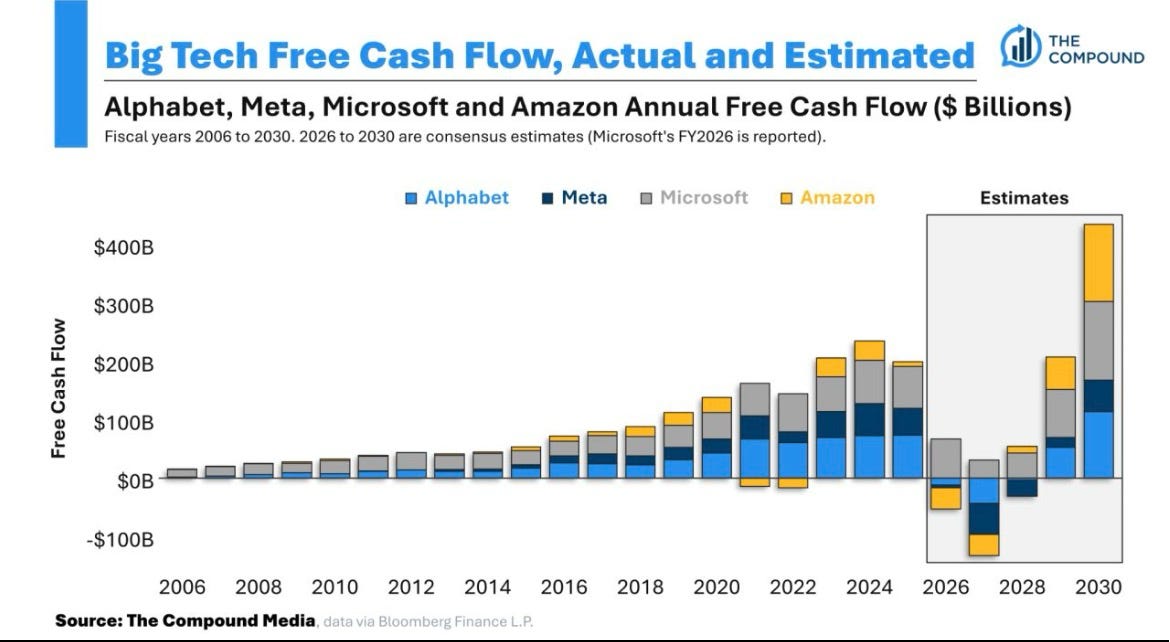
14. Actual and estimated big tech cash flow.
This data center buildout is fueled almost entirely by long-term debt. Revenue estimates need to hold up in order for the data center buildout to pay off.
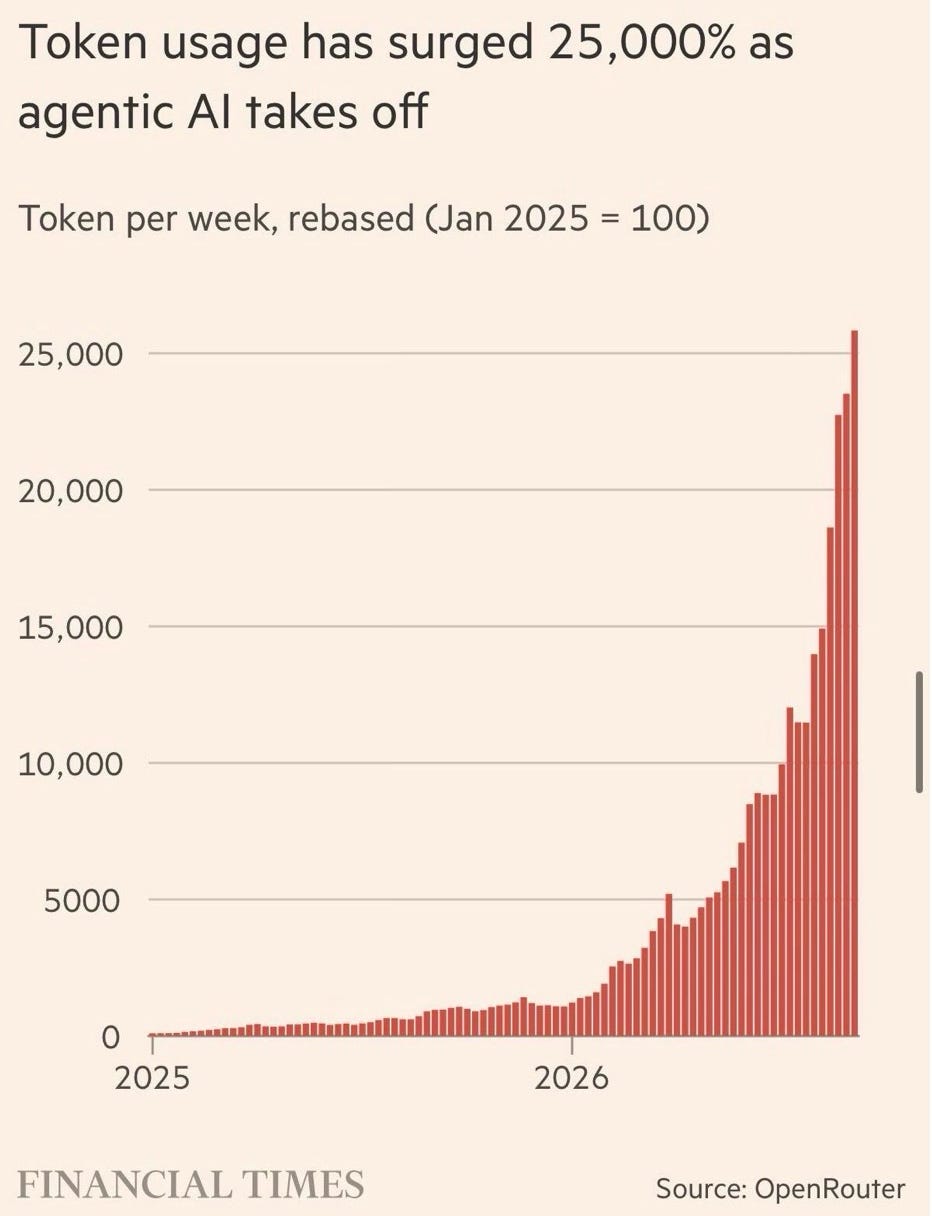
15. Token usage has surged 25,000%.
’Tokens’ are the universal currency of agentic AI. They’ve completely surged since 2025.
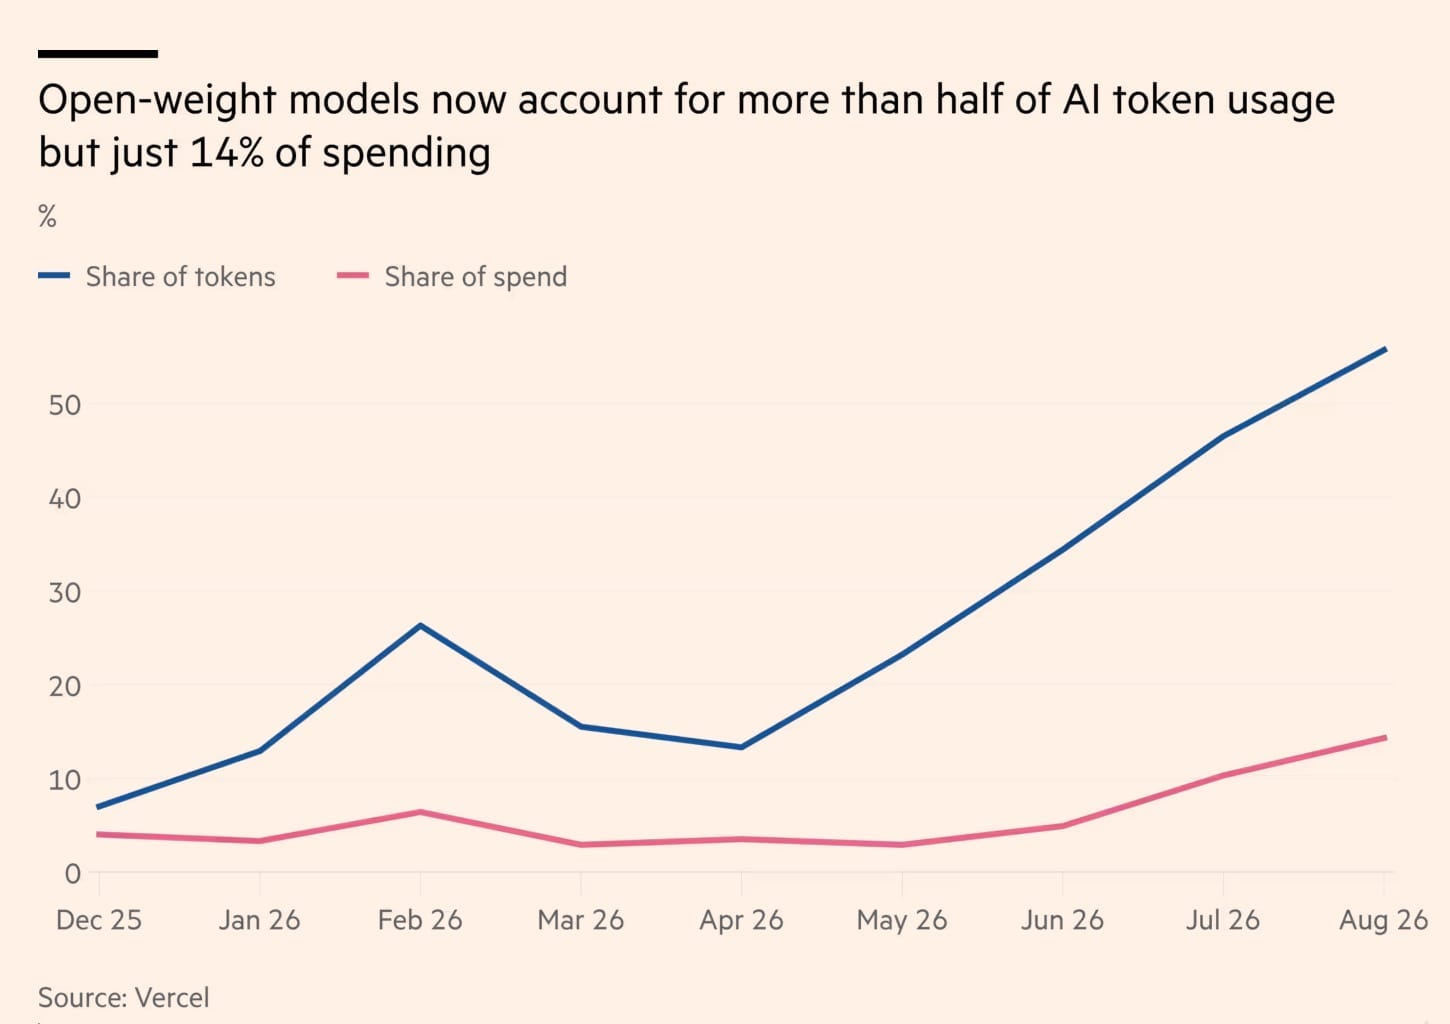
16. Open-weight models now account for half of token usage but only 14% of spending.
When DeepSeek broke the internet two years ago, there was speculation about whether large language models would become a commodity.
Now most tokens are consumed on open-weight models, at a fraction of the spending.
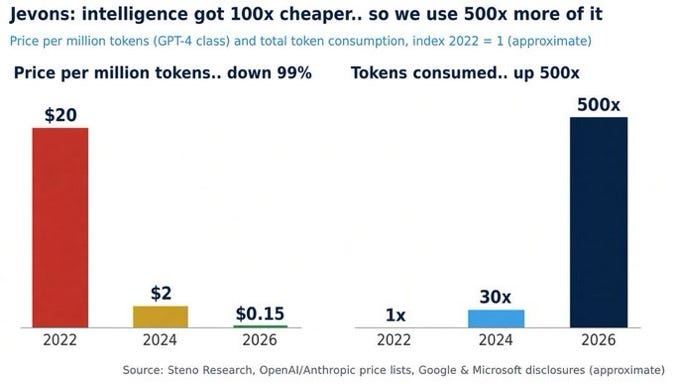
17. Compute got 100x cheaper, so we used 500x more of it.
Thanks, in part, to Moore’s Law, compute costs are falling faster than any other technology in history.
As the cost of intelligence (compute) gets cheaper, we use more of it. That, in a nutshell, is Jevons paradox.
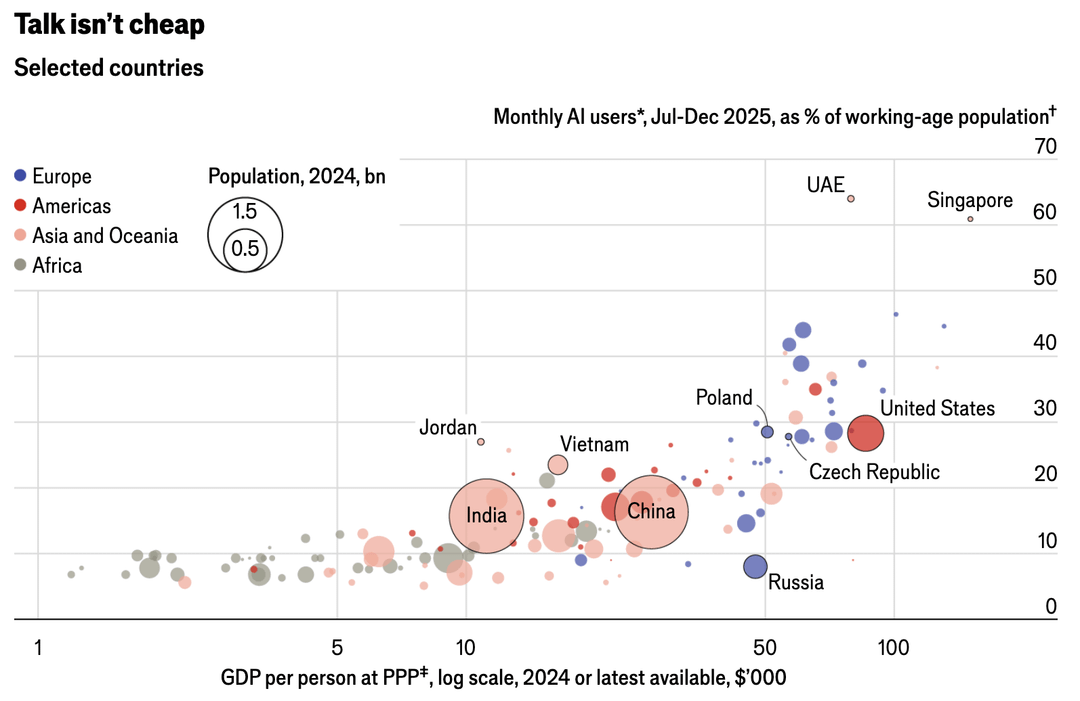
18. AI adoption is uneven globally.
High GDP countries tend to use AI more. This is probably due, in large part, to the digital service-based economies of developed nations.
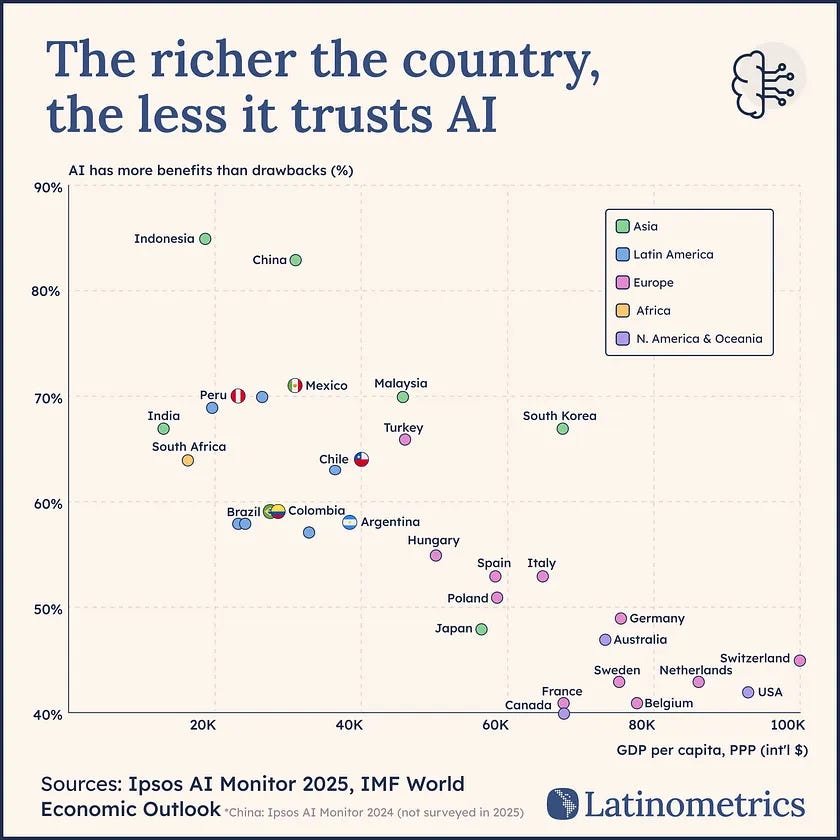
19. Rich countries trust AI less.
Is it possible that the more you use AI, the less you trust it? After all, there’s more optimism about AI in countries where its usage is lower.
Maybe it’s making us (and specifically AI-native countries) wildly rich, while simultaneously alienating the people who use it most?
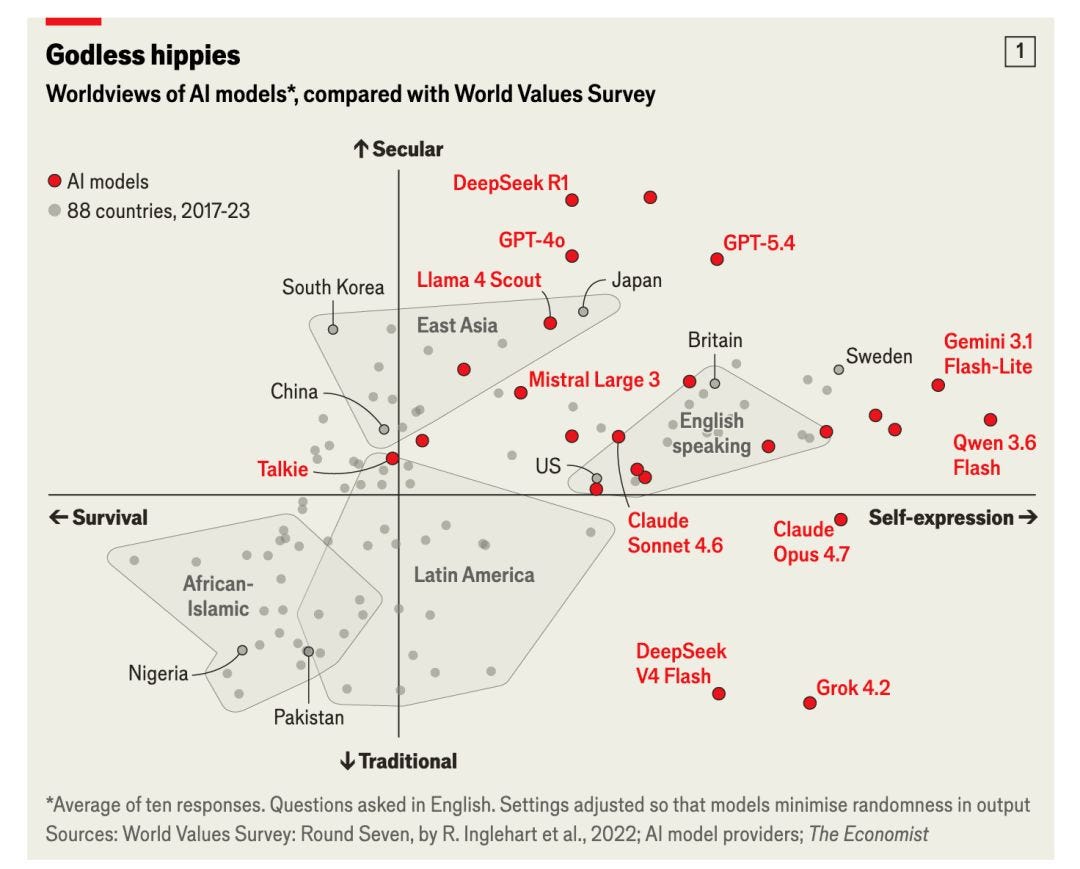
20. Large language models are disproportionately representative of Western worldviews.
When compared to the World Values Survey, most LLMs are self-expression seculars — or, as the chart puts it, godless hippies. Not very representative of the wordviews of Asia, Africa, or South America.3
Which makes sense given Silicon Valley built the LLMs, and China copied the code.
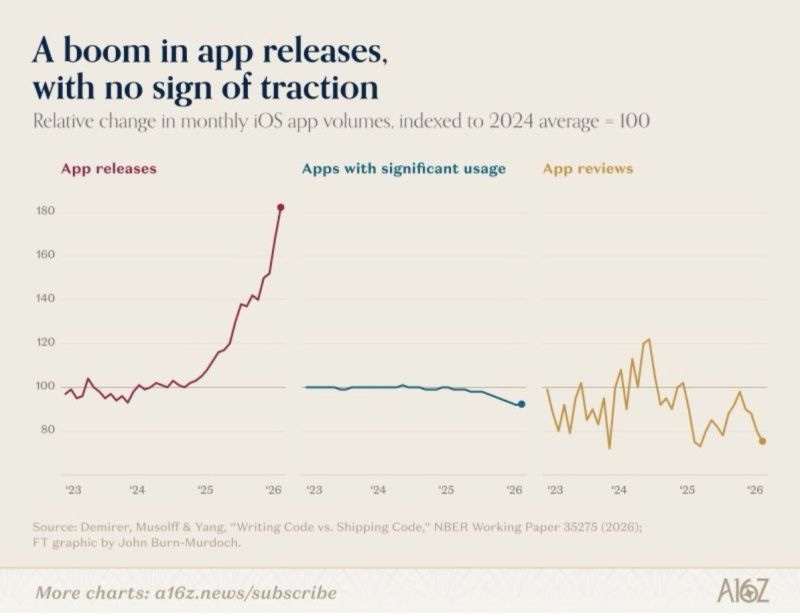
21. A boom in app releases, but little traction.
‘Vibe coding’ democratized software development. But it didn’t democratize taste. There’s still room for quality.
The solution is neither more quantity nor all quality with little quantity. It’s more quantity of quality.
CULTURE
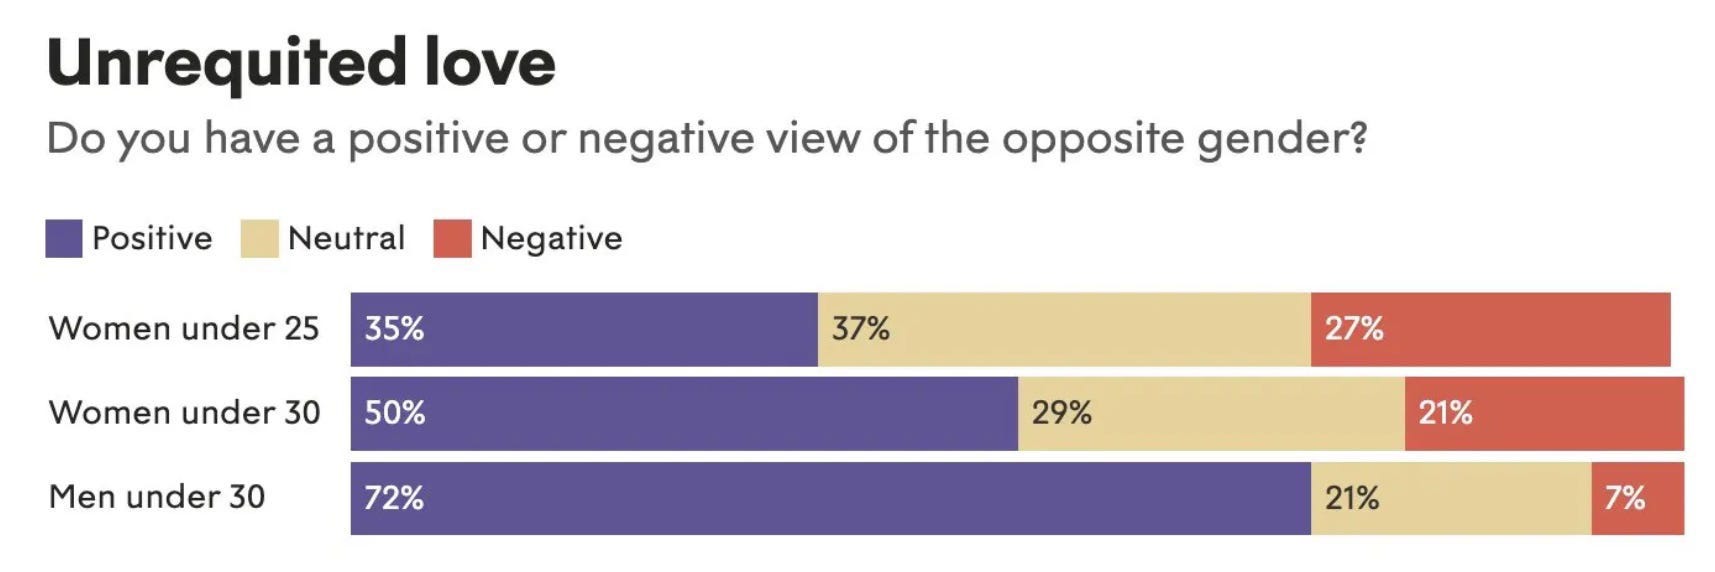
22. Young American women are increasingly pessimistic about men.
I can’t say I entirely blame women, either, when many young men are falling behind.
My advice to young men would be to cultivate the masculine counterpart of the feminine qualities you want your future wife to have. Eventually you’ll find her.
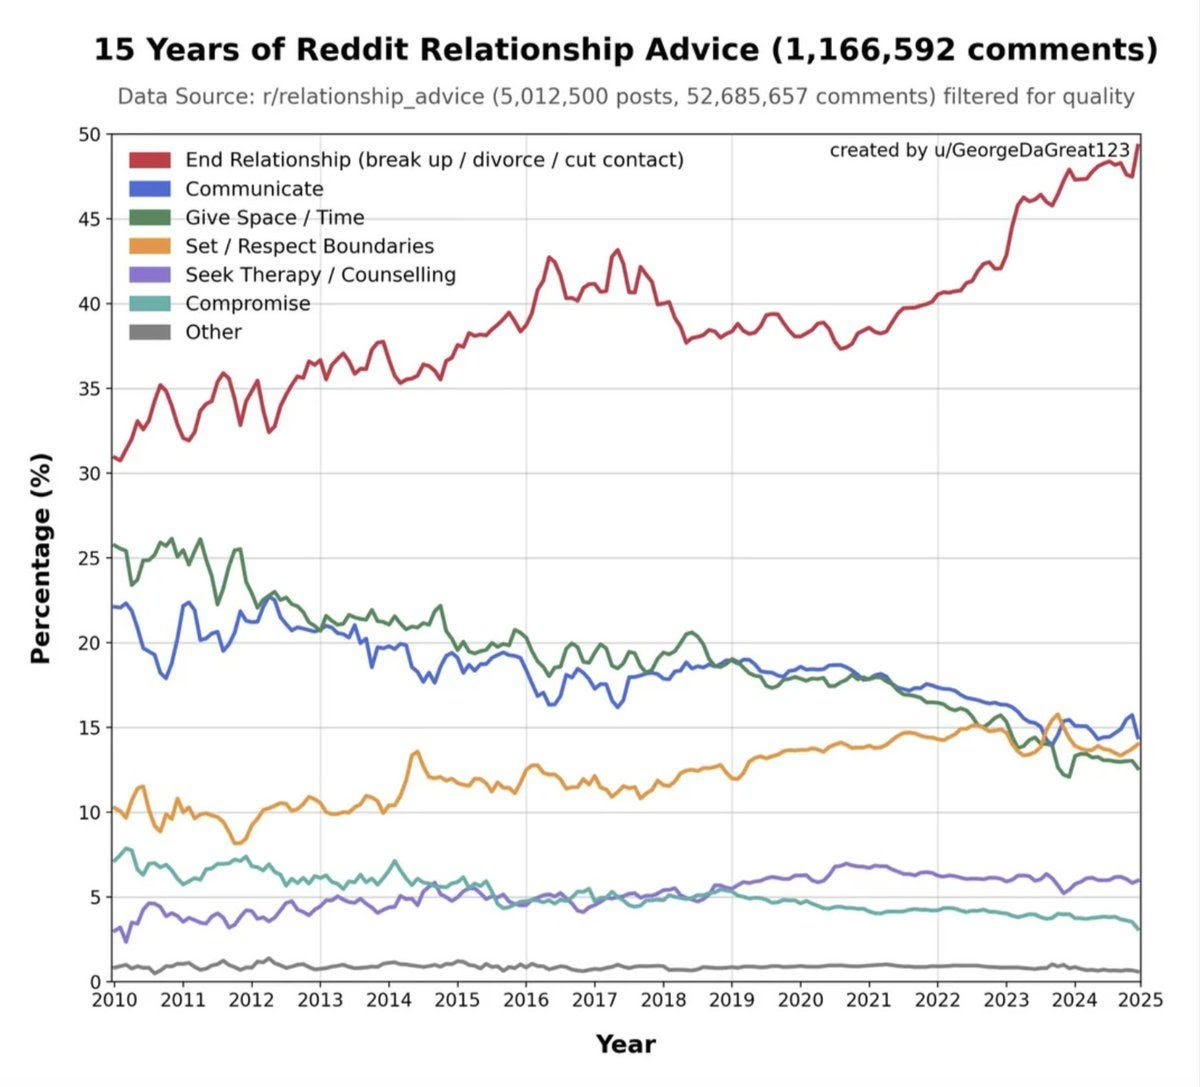
23. 15 years of Reddit relationship advice.
Reddit advice on r/relationship_advice disproportionately recommends ‘end relationship’ as a solution to relationship problems vs. other more amicable ends.
Note to self: Don’t seek relationship advice on Reddit.
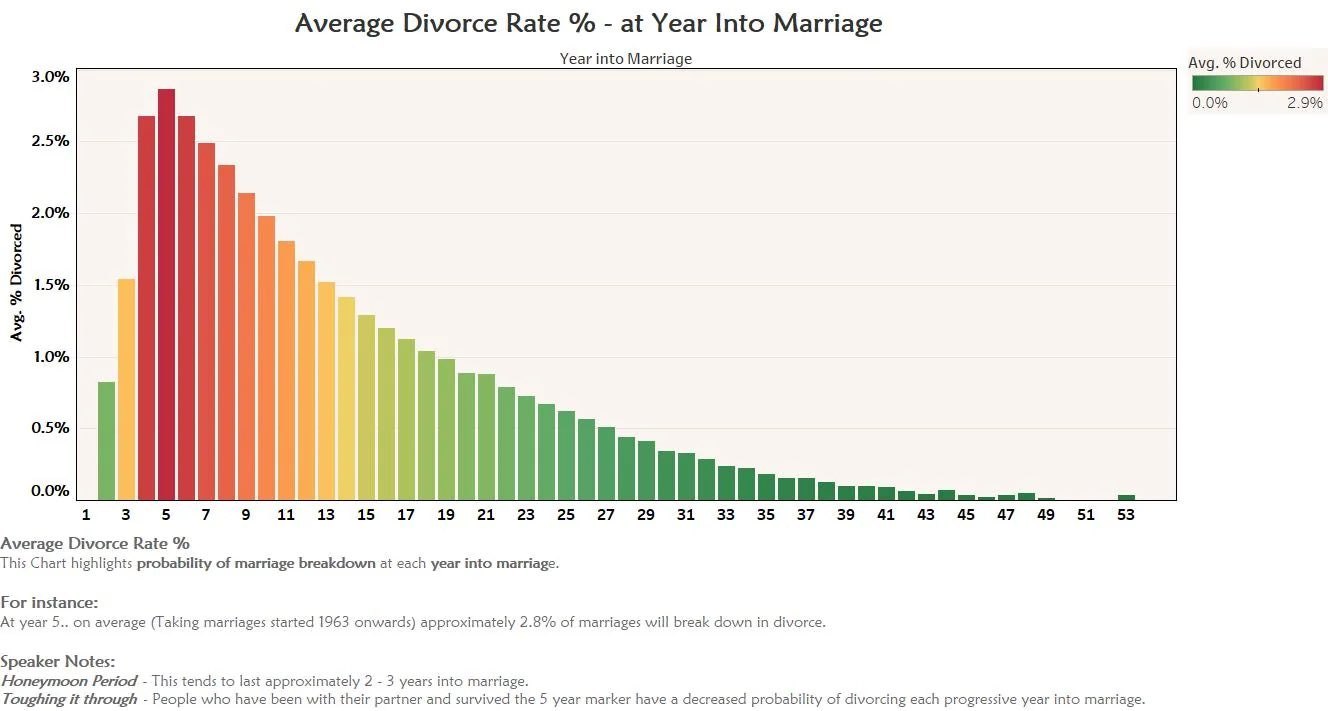
24. Average divorce rate peaks at five years, then declines.
It’s a good reminder that the first few years of marriage are a process of getting to know each other. After that, things are never perfect, but they get easier.
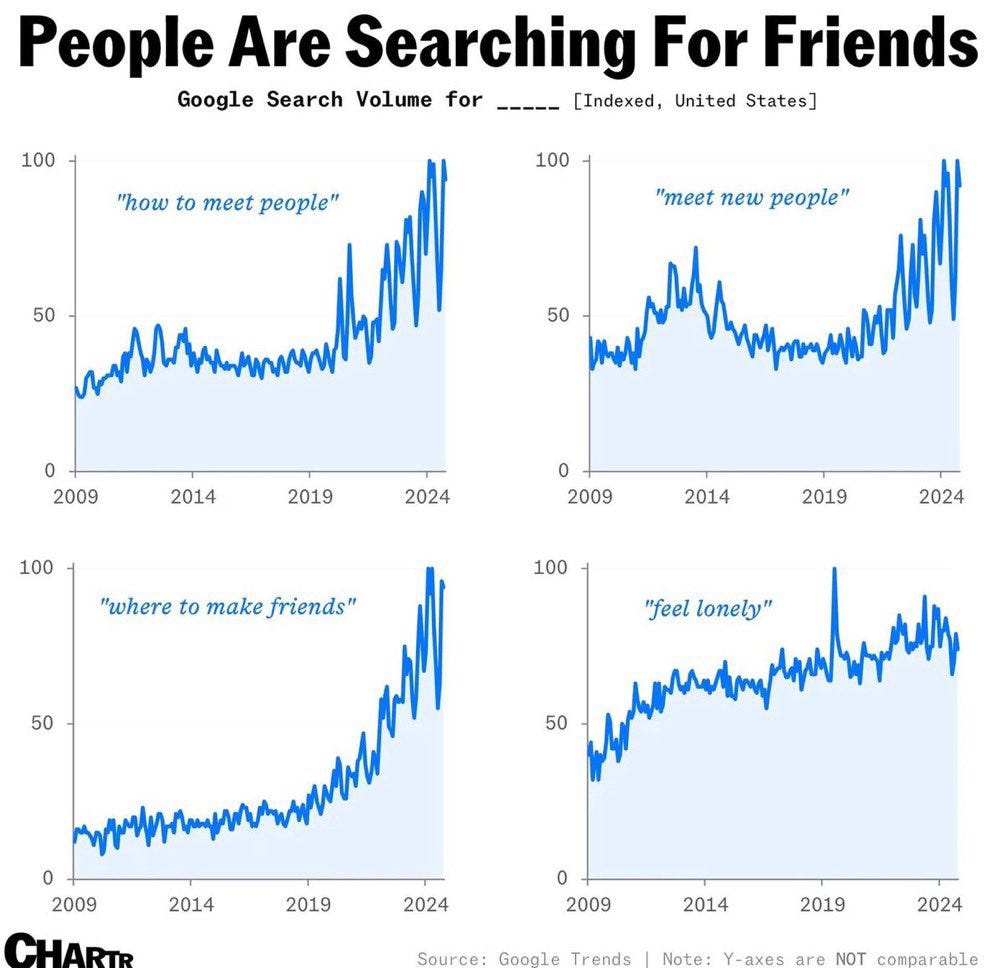
25. People are looking for friends.
AI therapists aren’t enough. People are increasingly searching for friends.
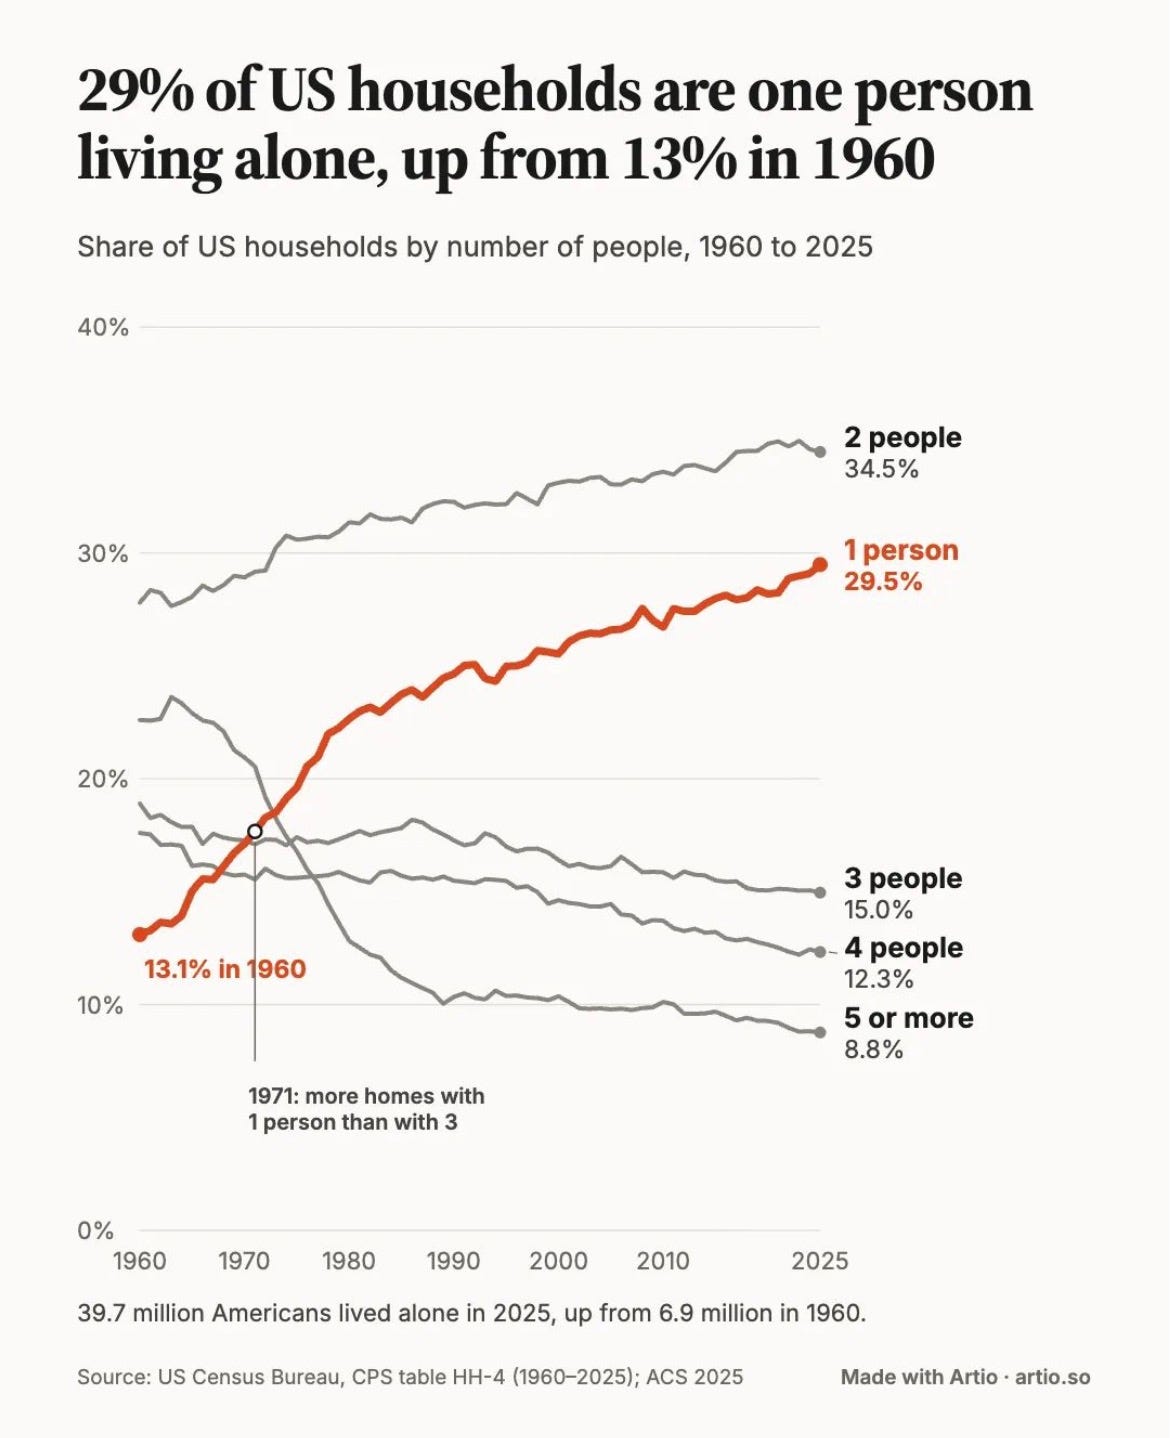
26. 29% of U.S. households are one person living alone — up from 13% in 1960.
Could this be why people are searching for friends online?
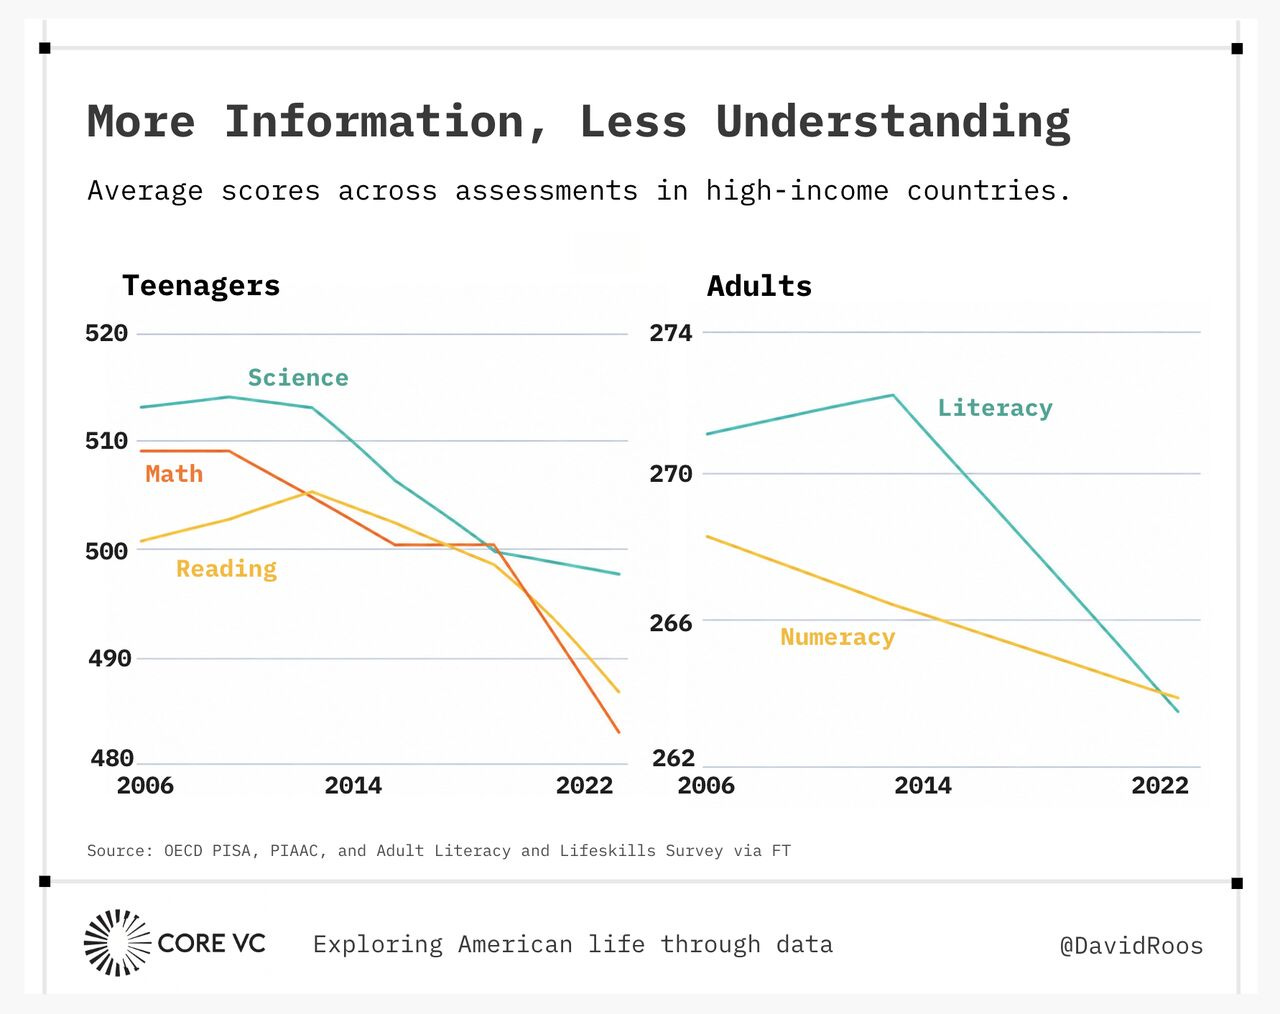
27. Test scores are collapsing internationally — for teenagers and adults.
My first thought is that the declining relative value of college degree in the marketplace could be explained by declining intelligence in young people? But it’s impacting both teenagers and adults alike.
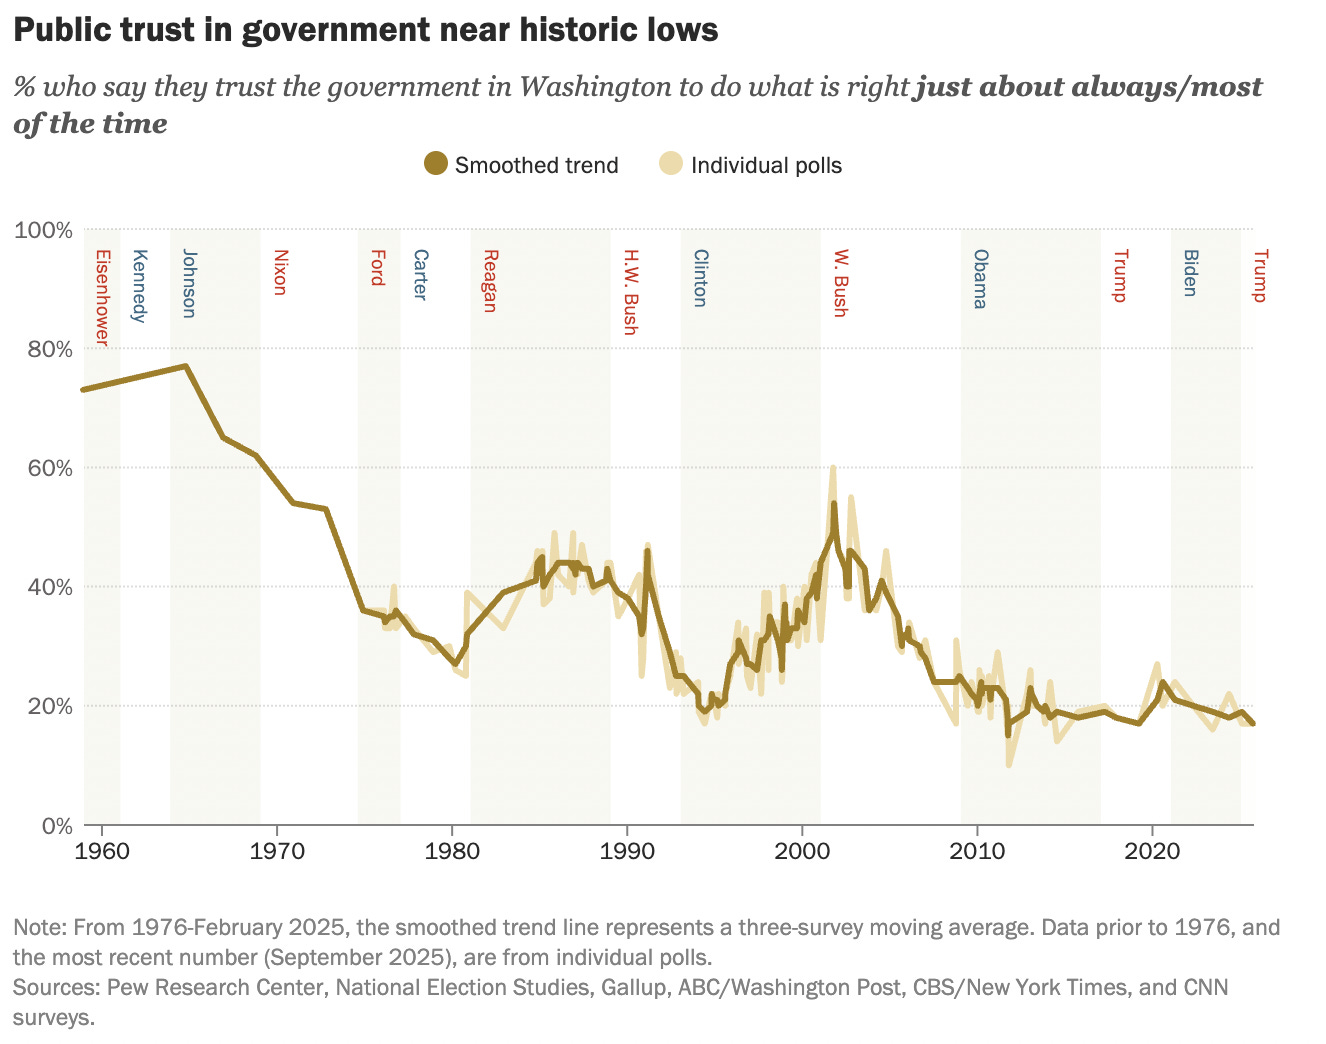
28. Public trust in government near historic lows.
The Watergate scandal kicked off American citizens’ declining trust in the government’s ability to do what is right.4 And we can’t simply blame social media, because the decline began well before its rise!
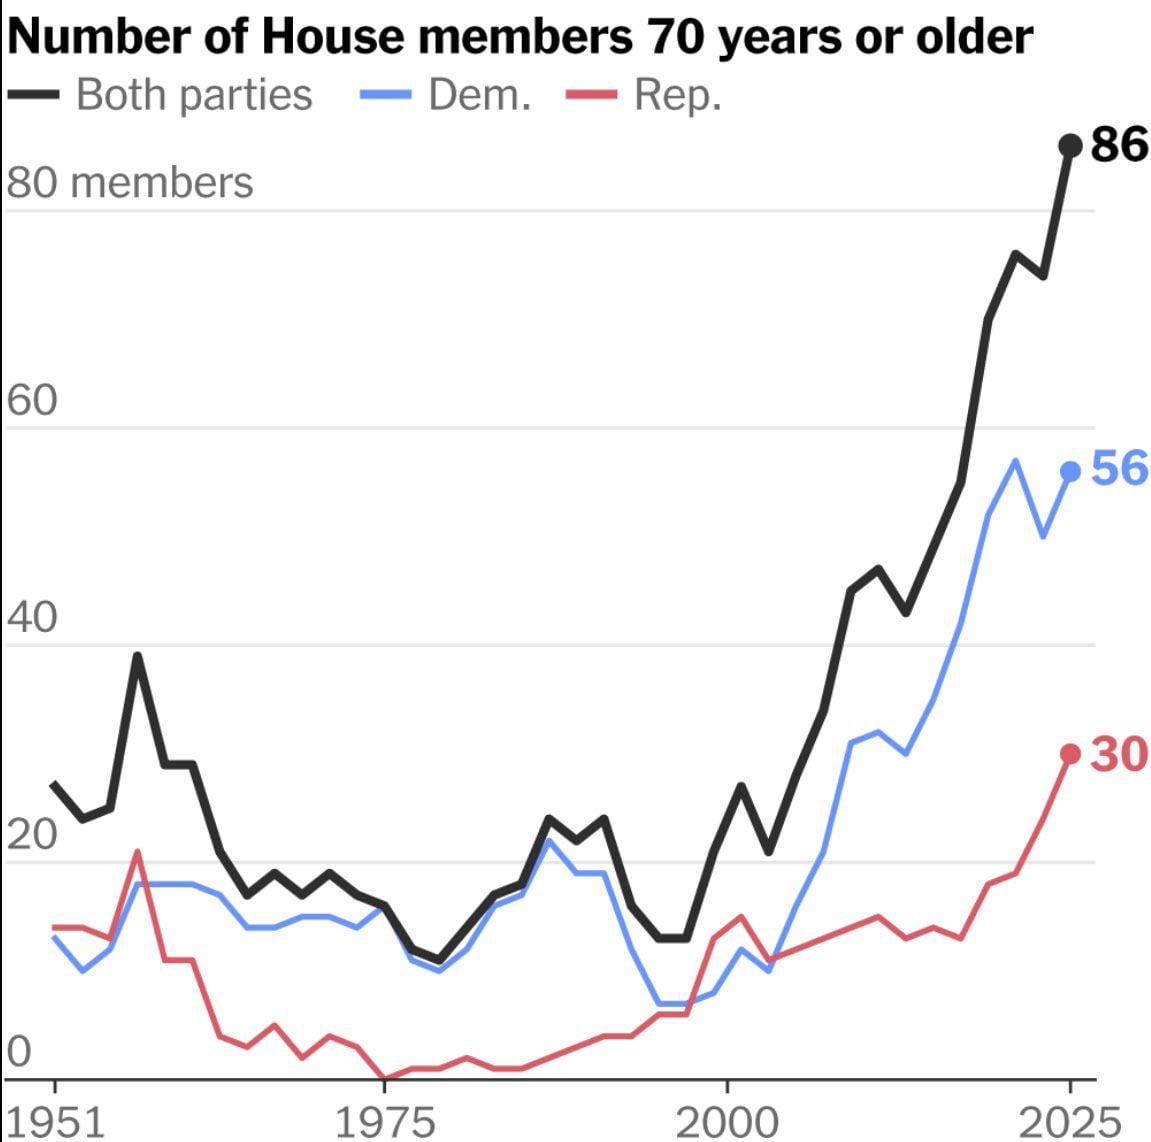
29. More members of the U.S. House are over 70 than ever.
Not sure if this has anything to do with public trust in government. But having people too old in government can definitely hurt
No wonder trust in institutions is at an all-time low. The percent of Congress over 70 is higher than it’s ever been since 1800.
I hope that you enjoyed reading this overview. I had a lot of fun curating the charts and writing the commentary! If you found it useful, please share with a colleague.
Thanks for reading!
— Grant Varner
Azoulay, P., Jones, B. F., Kim, J. D., & Miranda, J. (2019). Age and high-growth entrepreneurship. Retrieved from Link.
See also:

These cities got hit hardest with declining home prices since their peak in 2020. Once in a decade buying opportunity for a Barton Springs condo right across the street from Terry Black’s BBQ? Easy — hell yes. Next question.
It makes me wonder how many swing voters used AI to vote? And how the particular LLM they used influenced their vote one way or another?
Personally, I find it interesting how George Bush’s response to 9/11 galvanized a lot of public trust in the government.